Figure 4.
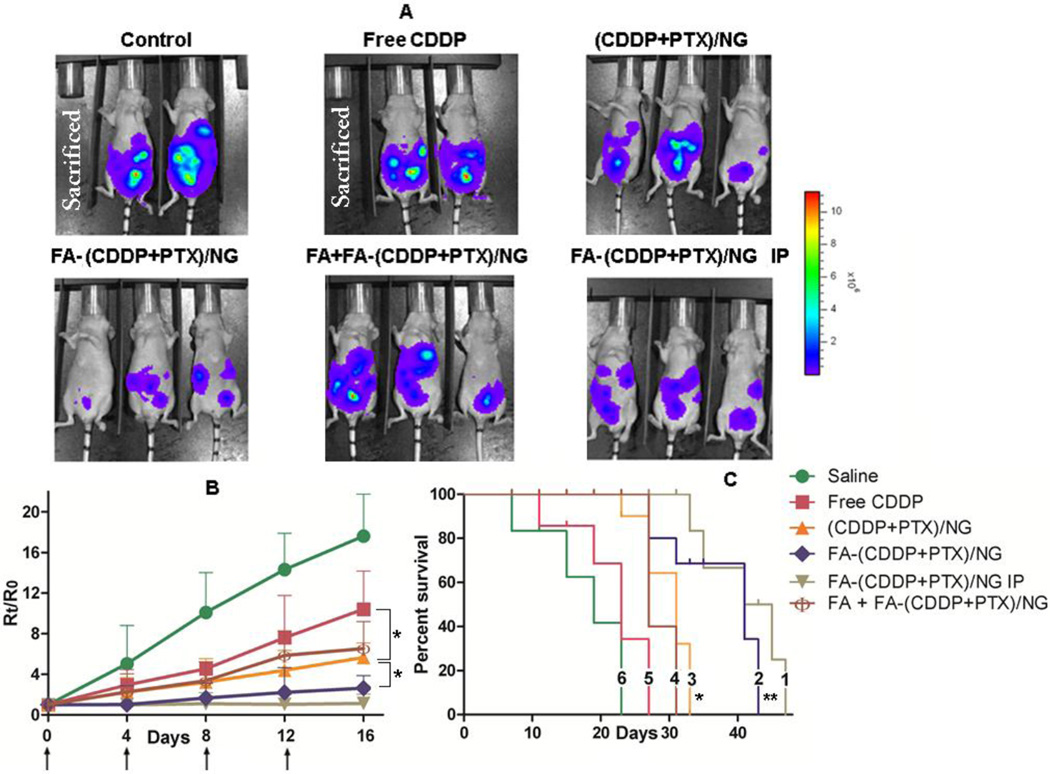
In vivo antitumor efficacy of FA-(CDDP+PTX)/NG in A2780/Luc human ovarian cancer xenograft-bearing female nude mice. (A) Bioluminescence images of each 3 mice representative for 8 mice per experimental arm after treatment (day 16). The colored scale bar indicates the intensities of bioluminescence in photons/s/cm2/sr. (B) Comparison of tumor growth inhibition following IV administration of FA-(CDDP+PTX)/NG (◆) or (CDDP+PTX)/NG (▲) or mixture of 1 mg/kg FA and FA-(CDDP+PTX)/NG (ϕ) or free CDDP (■) or 5% dextrose (control) (●). We used one additional group which received IP injection of FA-(CDDP+PTX)/NG (▼). Drug formulations were injected in100 µL at a dose of 4 mg CDDP or 1mg PTX equivalents/kg body weight 4 times at 4-day intervals as indicated by the arrows. Data presented in terms of relative bioluminescence units (Rt/Ro) to the day when treatment was initiated for individual animal. Values indicated are means ± SD (n = 8), *P < 0.05. (C) Kaplan–Meier analysis of overall survival in FA-(CDDP+PTX)/NG IP group (1) or FA-(CDDP+PTX)/NG IV group (2) or (CDDP+PTX)/NG (3) or FA + FA− (CDDP+PTX)/NG (4) or free CDDP (5) or control group (6). Log-rank test was used to determine statistical difference between (CDDP+PTX)/NG and free CDDP groups, *P < 0.05, and between FA-(CDDP+PTX)/NG and (CDDP+PTX)/NG groups, **P < 0.01.

