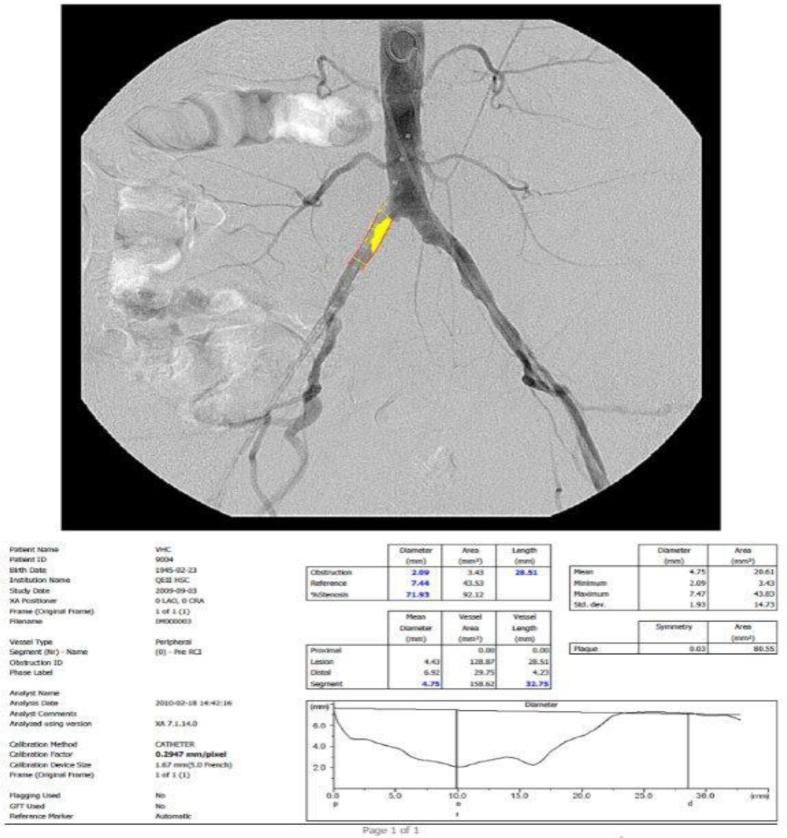
Figure 1.
A pre-stenting pelvic angiogram showing the catheter calibration method. The segment used for calibration is displayed in red lines. Information listed on the lower left refers to the analysis parameters (particular to each subject). The tables display quantitative values for diameters of the measured obstruction, reference, and subsequent percent stenosis (blue). Mean diameter is displayed (in blue) as well as the segment profile from proximal to distal (line graph) image.

