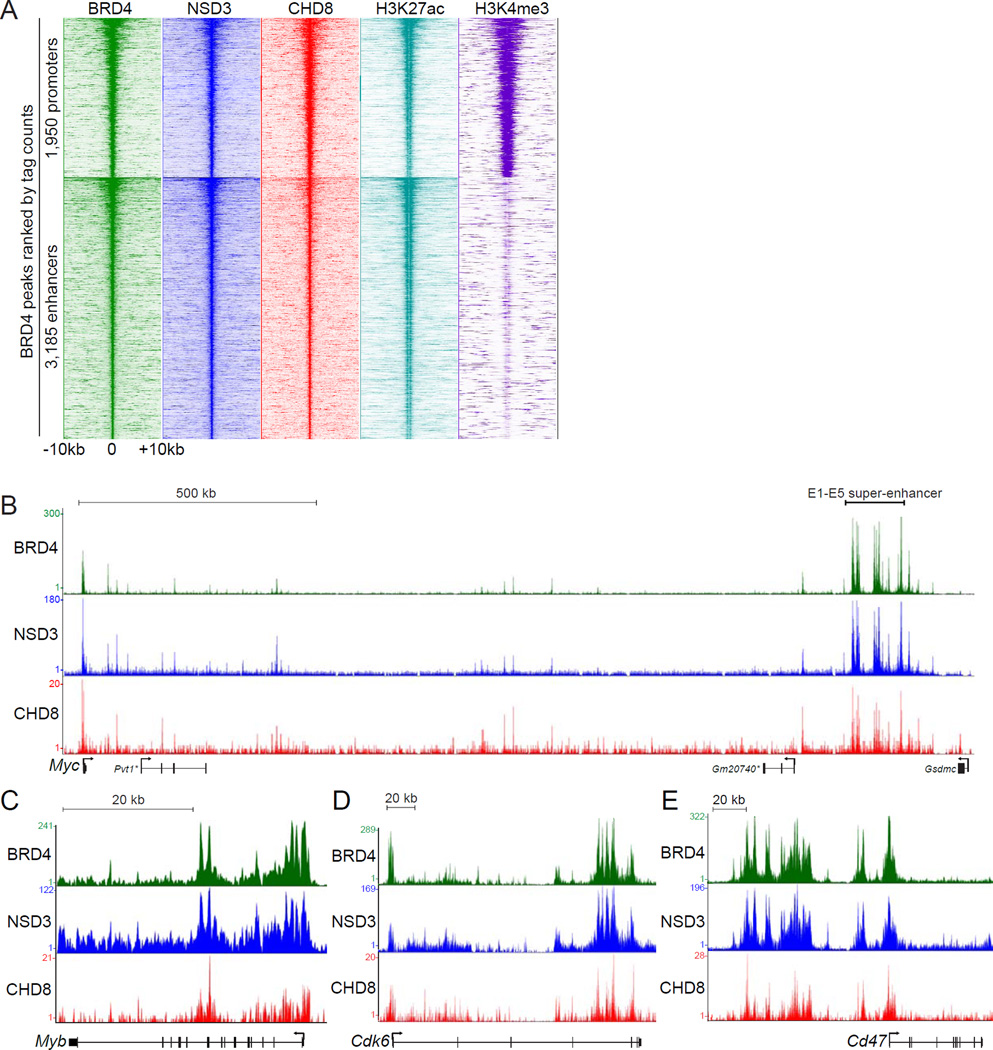
Figure 5. Genomewide colocalization of BRD4, NSD3, and CHD8 at active promoters and enhancers across the AML genome.
(A) Density plot analysis comparing ChIP-seq datasets obtained using the indicated antibodies. Indicated is a 20 kilobase interval surrounding 1,950 BRD4-occupied promoters and 3,185 BRD4-occupied enhancers, identified previously as high-confidence BRD4 occupied sites (Roe et al., 2015). H3K27ac and H3K4me3 datasets from RN2 were described previously (Shi et al., 2013a). Each row represents a single peak. (B–E) ChIP-seq occupancy profiles with the indicated antibodies at various loci. The y-axis reflects the number of cumulative tag counts in the vicinity of each region. Validated transcript models from the mm9 genome assembly are depicted below. The asterisks indicate non-coding RNAs. See also Figure S5.

