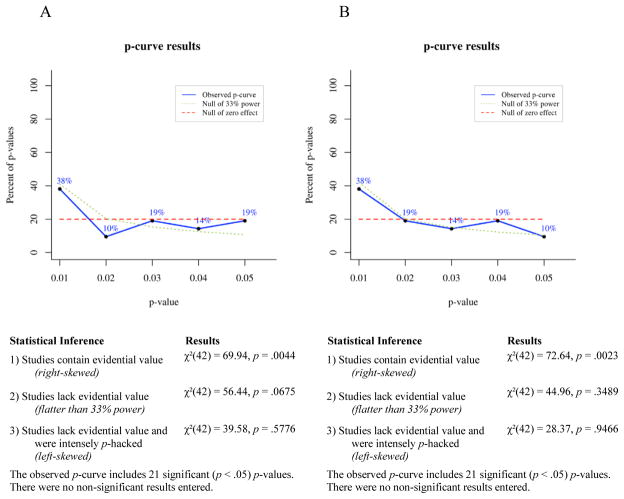
Figure 6.
P-curves of findings showing vigilance toward negative information from studies that did not show avoidance of positive information. Within-subjects effects were given priority for inclusion in the p-curve on the left (A), followed by between-subjects effects, followed by correlations. For the p-curve on the right (B), between-subjects effects were given priority for inclusion, followed by within-subjects effects, followed by correlations. Note. Blue line represents distribution of p-values.

