
Figure 4.
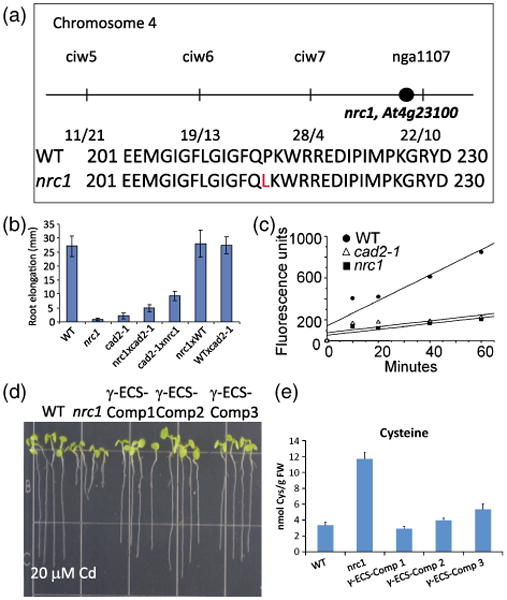
Characterization of the non-response to cadmium mutant nrc1.
(a) Mapping of the nrc1 mutant placed the mutation on chromosome 4 between the ciw7 and nga1107 markers. Candidate gene sequencing identified a point mutation in At4g23100, which causes a Pro → Leu (P214L) change in the γ-glutamylcysteine synthetase protein.
(b) Crosses between nrc1 and cad2-1 show the mutants are allelic. The short-root phenotype of the nrc1 and cad2-1 mutants grown on 20 μm cadmium (Cd) is not rescued in the nrc1 × cad2-1 or the cad2-1 × nrc1 F1 cross, but crossing either mutant into WT restores root elongation in the F1 generation.
(c) nrc1 is deficient in γ-EC synthetase (γ-ECS) activity. An in vitro assay was performed to determine the activity of the γ-ECS protein from wild-type (WT), nrc1 and cad2-1 plants. γ-EC synthetase activity was measured by tracking γ-EC appearance using HPLC-MS in crude extracts (rosette leaves) obtained from wild-type Col-0 (full circles), nrc1 (full squares) and cad2-1 (empty triangles). Extracts obtained from WT plants showed a steady synthesis of γ-EC during the assay, whereas nrc1 and cad2-1 showed only marginal increases in γ-EC concentration during the assay.
(d) Expression of genomic γ-ECS in the nrc1 mutant behind a constitutive promoter restores root elongation on Cd. Three independent T2 transformants (Comp1–Comp3) were used for root elongation experiments on 20 μm Cd.
(e) Seven-day-old complementation lines (γ-ECS Comp1–Comp3) were also used for fluorescence HPLC-MS analyses following 48 h of 100 μm Cd treatment. Cysteine levels in the nrc1 mutant are three to sixfold higher than in the WT (66.6 ± 8.22 nmol Cys per g fresh weight in nrc1 compared with 11.8 ± 0.71 nmol Cys per g fresh weight in WT), whereas all three of the γ-ECS complemented (γ-ECS-Comp) lines show a WT cysteine accumulation. All bar graphs show the mean of between three and six independent samples. Error bars represent the standard error of the mean (SEM).