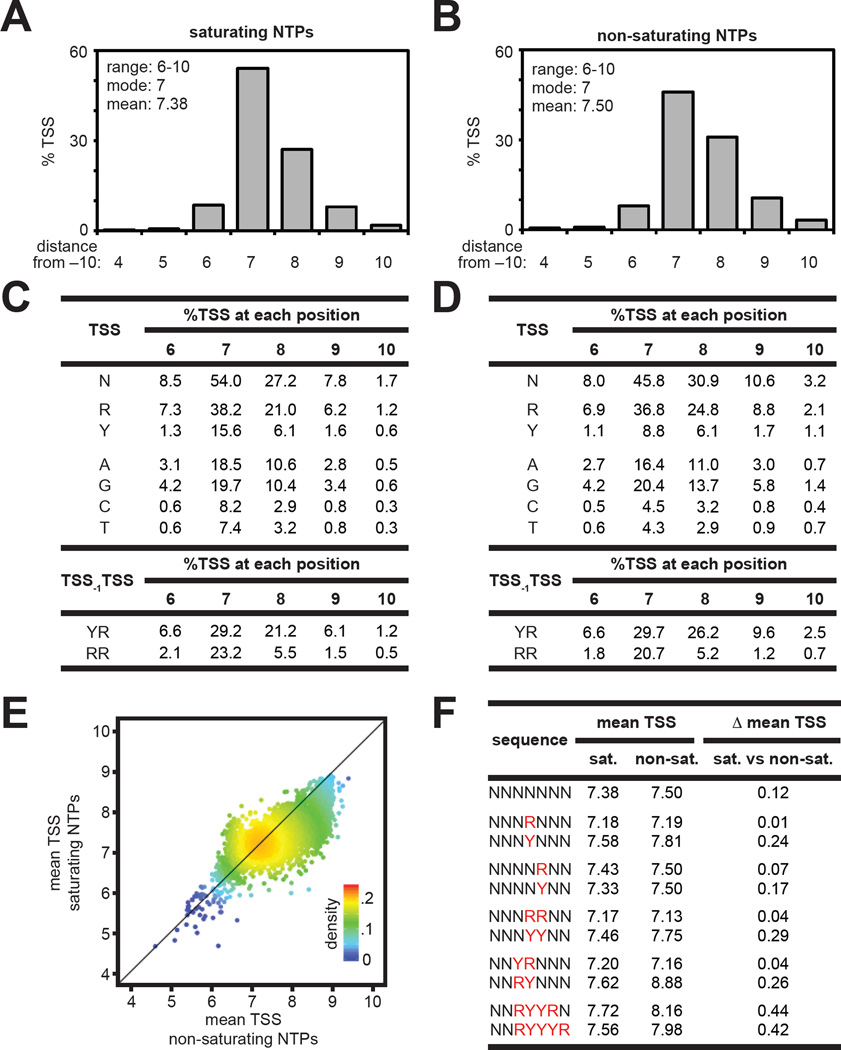
Figure 4. Effects of NTP concentrations on TSS selection in vitro.
A. and B. TSS-distribution histograms at saturating (A) and non-saturating (B) NTP concentrations in vitro. Average %TSS at positions 4–10 for TSS-regions with ≥25 matched RNA reads (Tables S4 and S5). Experiments were performed at 2.5 mM NTPs:Mg2+ (saturating) or 0.1 mM NTPs (non-saturating) using a non-supercoiled linear DNA template.
C. and D. Sequence determinants for TSS selection. (C, saturating NTPs; D, non-saturating NTPs)
E. Plot of the mean TSS at saturating NTP concentrations versus non-saturating NTP concentrations for individual TSS-region sequences.
F. Average of the mean TSS values observed for the indicated TSS-region sequences at saturating (sat.) and non-saturating (non-sat.) NTP concentrations. (Δ mean TSS; differences between values observed at saturating and non-saturating NTP concentrations)

