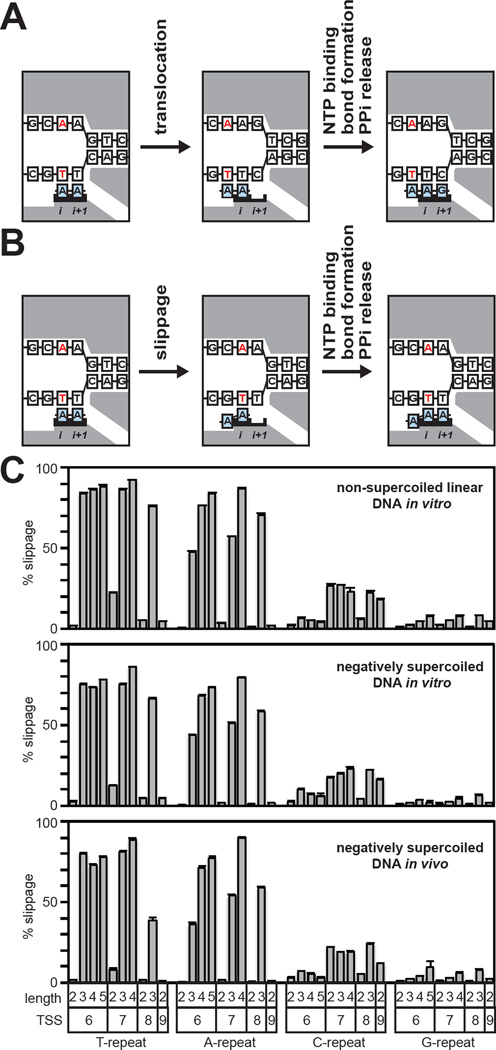
Figure 5. Comprehensive analysis of productive slippage synthesis.
A. Nucleotide addition cycle for the standard pathway of transcription initiation. Left: initial transcribing complex with a 2-nt RNA in a pre-translocated state. Middle: initial transcribing complex with a 2-nt RNA in a post-translocated state. Right: 3-nt product complex in a pre-translocated state. The RNA and DNA template strand remain in lock-step register and the sequence of the RNA is fully complementary to the template strand. White boxes, DNA; blue boxes, RNA; gray shading, RNAP; red, TSS bases; i and i+1, RNAP active-center i and i+1 sites.
B. Nucleotide addition cycle for the slippage pathway. Left: initial transcribing complex with a 2-nt RNA in a pre-translocated state. Middle: RNA has moved backward relative to the DNA template by one base. Right: 3-nt product complex in a pre-translocated state. The 5′ end of the RNA carries an RNA/DNA difference and is not complementary to the template strand.
C. Analysis of productive slippage synthesis. Graphs show % slippage (mean + SEM) for TSS-region sequences containing 5′ end homopolymeric repeat sequences of the indicated length that begin at the indicated position (TSS).
(See Figure S5)

