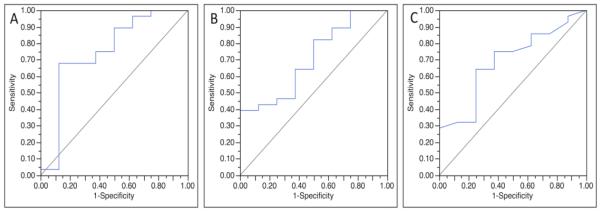
Figure 4.
Receiver operating characteristic (ROC) curves for three MRI factors found to have potential to discriminate low risk DCIS from high risk DCIS. Normalized apparent diffusion coefficient (ADC) provided the greatest discriminative ability (area under ROC curve (AUC) = 0.75) (A), followed by diffusion weighted imaging contrast-to-noise ratio (CNR) (AUC = 0.71) (B) and maximum lesion size on dynamic contrast enhanced (DCE) MRI (AUC = 0.69) (C).

