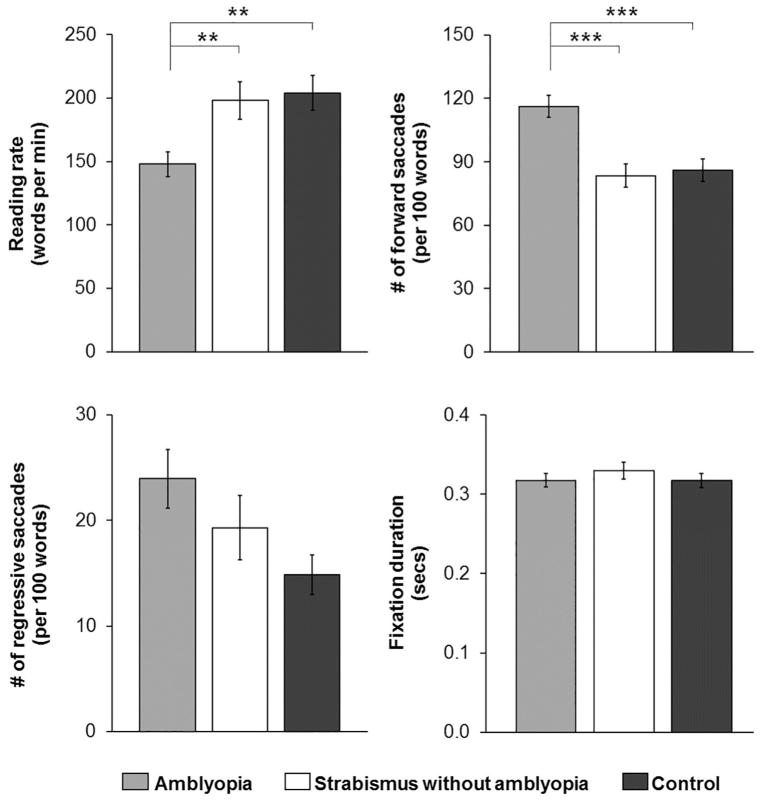
FIG 1.
Bar graphs depicting group means for reading rate, number of forward saccades, number of regressive saccades, and fixation duration for amblyopic children (light gray bars), treated strabismic (or combined mechanism) children without amblyopia (white bars), and normal control children (dark gray bars). Amblyopic children were significantly slower at reading and produced more forward saccades compared with treated strabismic children without amblyopia and normal control children. Error bars represent ± standard error of the mean (SEM). *P < 0.05, **P < 0.01, *** P < 0.001.

