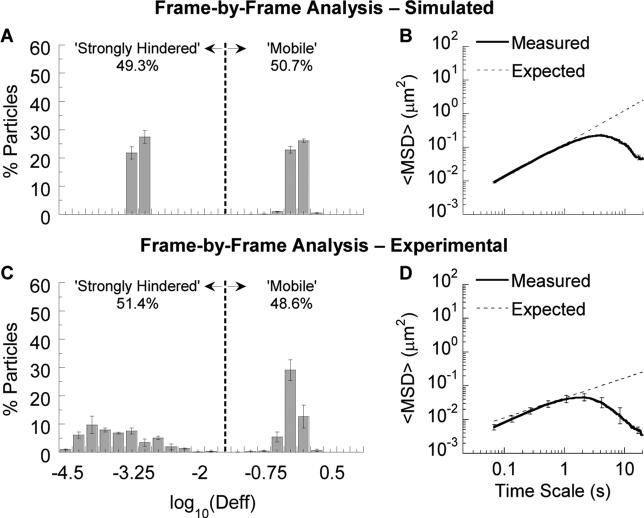
Figure 3.
Application of frame-by-frame analysis to simulated and experimental particle trajectory data. (A,C) Deff distribution and (B,D) ensemble geometric average MSD. In (A,C), the vertical dashed line indicates the cutoff between strongly hindered and mobile particles (see Methods). Error bars represent standard error across 3 independent data sets or mucus samples.

