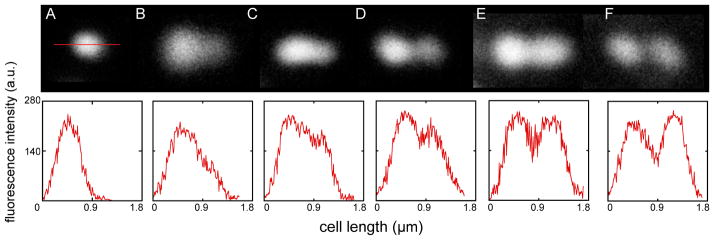
Figure 6.
Bud-like morphology of TM7x. (A–F) Magnified images of TM7x from the co-culture stained with a TM7x-specific FISH probe. Representative images were selected from FISH staining of co-culture grown under microaerophilic conditions. These images are not a time series, but rather a collection of different cells from the FISH imaging. XH001 staining is not shown. Different stages of bud growth can be seen throughout all time points of the co-culture growth. These images were further analyzed by graphing the length (x-axes) versus fluorescent intensity of Cy-5-TM7567 (y-axes) along the red line drawn across the budding cells (see red line in A). (A) Representative image of cocci TM7x is shown. (B) Very beginning of bud formation is shown by one large coccus with a small tail-like formation. (C) Further bud development is evidenced by a clearer tail-like formation. (D) Two connected cells are represented. One cell is smaller than the other, possibly formed from the tail-like structure. (E) Two cells that have clear separation but still connected by weak fluorescent signal. (F) Finally, two cells that are separated and have clear boundaries. The scale bar in the images are not displayed since the graph is accurately showing the cell length.

