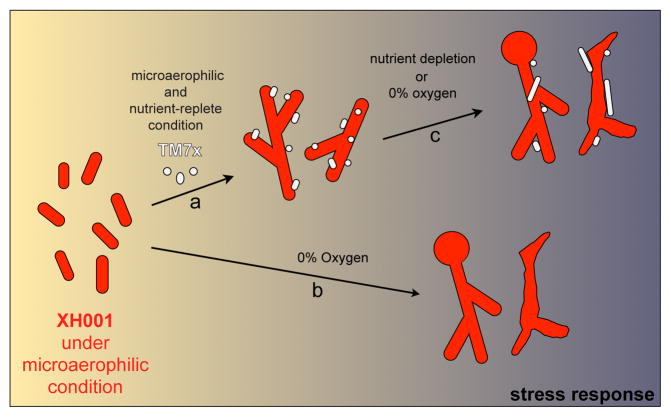
Figure 8.
Diagram depicting morphological changes of XH001 and TM7x under different conditions. XH001 and TM7x bacteria are shown in red and gray respectively. Arrows represent the changes in condition of the culture environment: (a) attachment of TM7x to XH001 under microaerophilic nutrient-replete environment, (b) incubation of XH001 alone under oxygen deplete environment, and (c) co-culture under nutrient or oxygen deplete condition. Increasing dark color in the background represents increase in stress response genes.

