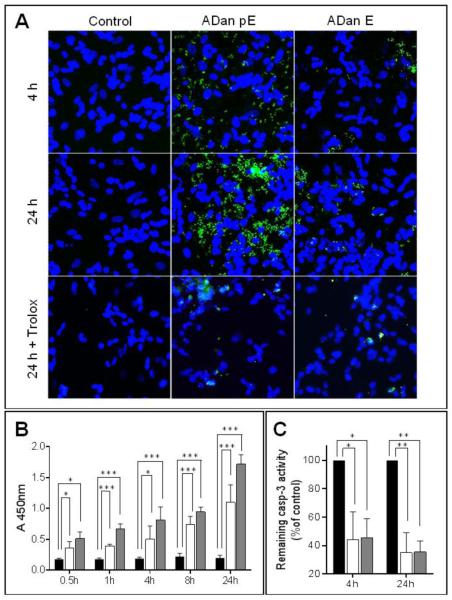
Figure 10. ADan-mediated Caspase-3 activation and inhibition by treatment with the antioxidant Trolox.
SH-SY5Y cells were challenged with ADan pE/E (50 μM) for 4, 8, or 24h and cleaved (active) caspase-3 evaluated by IF microscopy (A) and by quantitation via In-Cell ELISA (B-C). The protective effect of ROS scavengers was assessed by co-incubation of the amyloid peptides with 300 μM Trolox. (A) IF microscopy. Green fluorescence indicates cleaved caspase-3 immunostaining; blue fluorescence represents nuclear DNA counterstained with To-Pro. Magnification = X40 in all cases; (B) SH-SY5Y cells were treated with ADan pE/E (50 μM) for different times (0.5-24h) and intracellular caspase-3 activation by quantitated by ELISA. Black bars indicate untreated control cells; white bars illustrate cells challenged with ADan E and gray bars ADan pE-treated cells. (C) Inhibition of intracellular caspase-3 activation in the presence of Trolox evaluated via ELISA. Values are expressed as percentage of controls in which cells were treated with the respective amyloid molecules in the absence of Trolox (black bars). As above, white bars illustrate cells challenged with ADan E and gray bars ADan pE-treated cells. In (B) and (C) graphs indicate mean ± SD of triplicate experiments. * indicates p<0.05, ** p<0.01, *** p<0.001.

