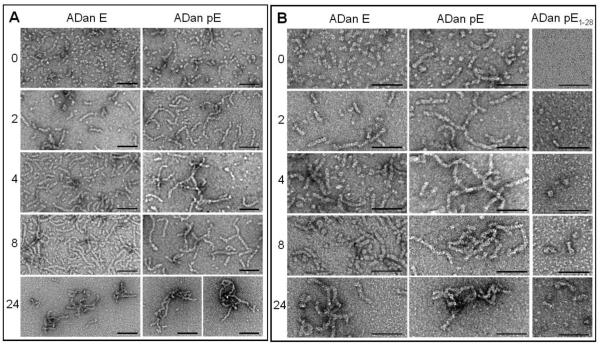
Figure 4. Electron microscopy study of ADan pE, ADan E, and ADan1-28.
The figure illustrates the changes in the conformational assemblies of ADan pE, ADan E, and the C-terminally truncated ADan1-28 after incubation under physiologic salt concentration for 0 to 24h.TEM analysis at each of the aggregation time points was performed, after negative staining with 1% uranyl acetate, using a Philips CM-12 microscope equipped with a Gatan (4k × 2.7k) digital camera. Left panels depict the images visualized under 88,000-magnification; right panels represent higher power images with 140,000 magnification. In all cases bars represents 50 nm.

