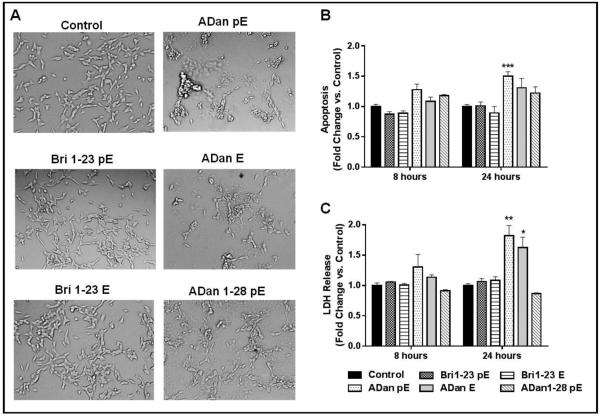
Figure 5. Neurotoxicity of Bri 1-23 and ADan peptide variants.
SH-SY5Y cells were challenged with 50 μM peptide for up to 24 h. (A) Cell morphology was evaluated using phase contrast microscopy following 24 h peptide treatment. Magnification = X20. (B) Apoptosis was evaluated by Cell Death ELISA after 8 and 24 h peptide treatment. Results are expressed as a fold of change of nucleosome formation compared to no-peptide controls at the respective time points. (C) The release of LDH to the culture supernatant was used as a measure of plasma membrane compromise. Results are expressed as a fold of change of LDH release compared to no-peptide controls at the respective time points. For B and C, data represent the mean ± SEM of three independent experiments. * = p<.05, ***=p<.001, ****=p<.0001

