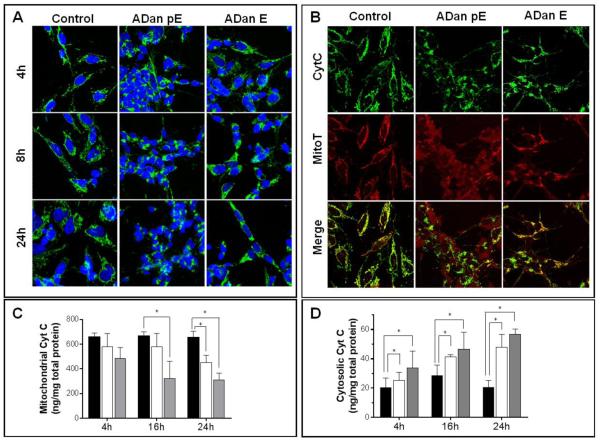
Figure 7. Mitochondrial alterations induced by ADan.
SH-SY5Y cells were challenged with ADan pE/E (50 μM) and subjected either to IF analysis or to subcellular fractionation followed by quantitative assessment of cyt c by ELISA to evaluate the release of the protein from the mitochondria. (A) SH-SY5Y cells were incubated with the amyloid homologues for 4, 8, and 24h and immunostained for cyt c. Green fluorescence indicates cyt c, blue fluorescence represents nuclear DNA counterstained with To-Pro. Magnification = X63 in all cases. (B) SH-SY5Y cells were challenged with ADan pE/E for 8h followed by staining with MitoTracker Red CM-H2XRos and cyt c immunocytochemistry. Top panel: cyt c fluorescence shown in green; Central panel: oxidized Mitotracker highlighted in red; Bottom panel: merged images. Magnification = X63 in all cases. (C-D) After incubation with ADan pE and ADan E for 4, 16, and 24h, SH-SY5Y cells were subjected to subcellular fractionation and cyt c quantitated by ELISA in the mitochondrial (C) and cytoplasmic (D) extracts. In both C and D black bars illustrate control untreated cells, white bars ADan E- and gray bars ADan pE-treated cells. In both graphs, bars represent mean ± SD of triplicate experiments. * indicates p<0.05

