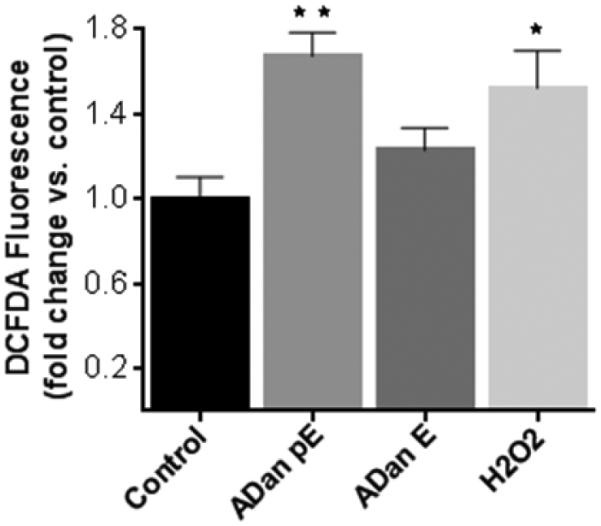
Figure 9. Assessment of intracellular ROS generation with the free radical indicator DCFDA.

SH-SY5Y cells were incubated with ADan pE and ADan E (50 μM, 4h) were loaded with DCFDA (10 μM, 30 min) and fluorescence, proportional to the intracellular ROS, was evaluated with Ex/Em wavelengths of 492–495 nm and 517–527 nm, respectively. Data are represented as percentage of corresponding no-peptide controls. Fluorescence elicited by incubation with 100 μM H2O2 is illustrated as a positive control. Bars indicate mean ± SD of triplicate experiments. * indicates p<0.05, ** p<0.01.
