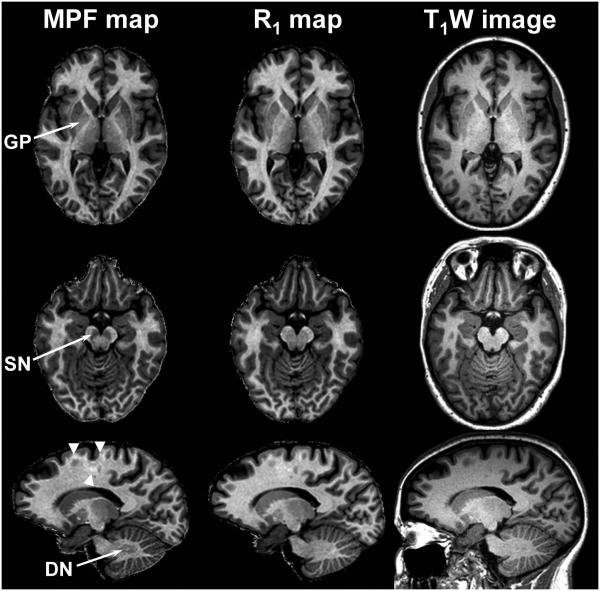
Fig. 4.
Reformatted sections of a 3D MPF map (left column), R1 map (middle column), and T1-weighted MPRAGE image (right column) comparing tissue contrast for iron-rich GM anatomical structures. Arrows indicate the globus pallidus (GP), substantia nigra (SN), and dentate nucleus (DN). Arrowheads indicate intrinsic variations of MPF within WM.

