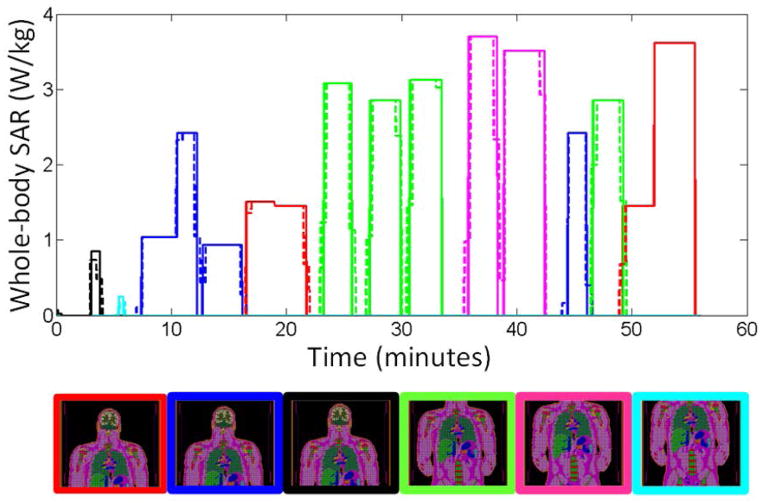
Figure 3.
Whole-body SAR levels recorded throughout an actual spine exam (solid line) and the levels averaged over 30-second intervals for rapid calculation (dashed line). The position of the body in the coil at each time is indicated in the figure below the line plot with a border corresponding to the color of the line at that time. The length of these figures is set to indicate the portion of the body physically within the body coil at the given time.

