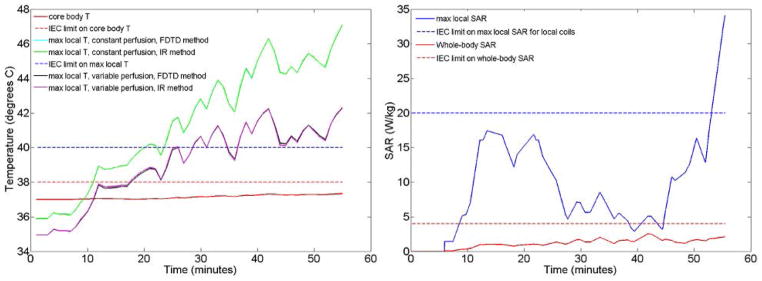
Figure 4.
Key temperatures (left) and SAR levels (right) throughout the sequence simulated. Local temperature and local SAR are plotted for locations where absolute maximum local temperature and absolute maximum local 10g-averaged SAR occur. All SAR levels are averaged over a 6-minute sliding window in time for comparison to regulatory guidelines, which makes them fluctuate differently than the whole-body SAR in Fig. 3 which is interval-wise constant. Local temperatures curves have been plotted for both the finite difference and the impulse response computation methods, showing that they are almost indistinguishable from each other. Allowance for increase in local perfusion creates a less conservative and less restrictive prediction of local temperature. Maximum local temperature and maximum local SAR occur at different locations and have different behaviors through time. Also maximum temperature with constant and variable perfusion rates occur at different locations, as apparent from the different starting temperatures.

