Figure 4.
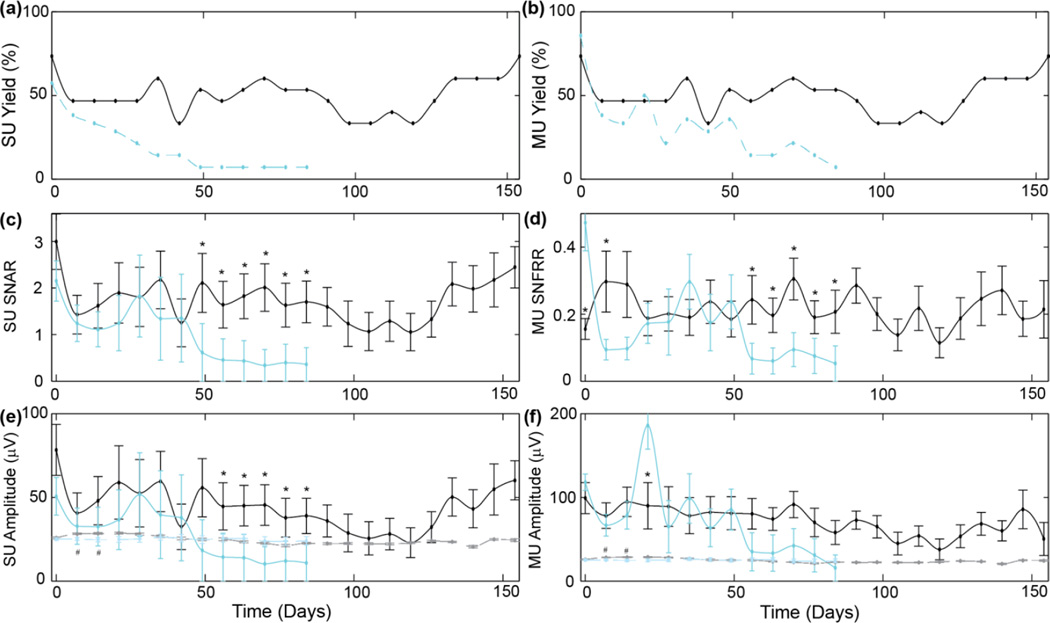
Chronic spike recording performance of PEDOT/CNT-(COOH)x (black) and PEDOT/PSS (blue) electrode sites. (a) SU yield, (b) MU yield. (c) SU signal-to-noise amplitude ratio for the largest isolated SU waveform. (d) Visually evoked MU signal-to-noise firing rate ratio. (e) Average amplitude of the largest SU waveform on each channel (solid line). (f) Average MU amplitude (solid line). (e–f) dashed line indicates noise floor. * indicates significant difference of SNR or Amplitude (p<0.05). # indicates significant difference in noise floor (p<0.05). Note: If no SU or MU were detected, SNR=0 and amplitude=0 µV. Average SU SNAR and SU amplitude may be lower than the noise floor if large number of recording sites had SNR=0 and amplitude=0 µV. As previously published, this was done to prevent misleading over characterization of ‘AVERAGE SNR’ by ignoring or removing ‘failed’ recording sites during averaging.

