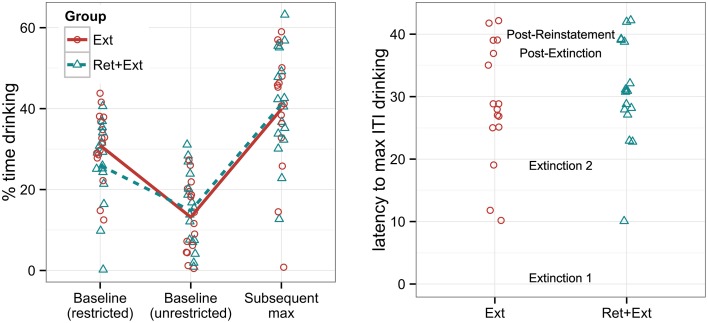
Figure 2.
Left panel: Percent time that rats spent drinking a 10% sucrose solution under baseline conditions with and without water restrictions, labeled “Baseline (restricted)” and “Baseline (unrestricted),” respectively, and the maximum ITI drinking reached either during or following extinction, labeled “Subsequent max.” Right panel: The latency (given by the cumulative number of tone-alone presentations across experimental sessions) for each individual to reach its personal maximum ITI drinking (the “Subsequent max” measurement given in the left panel). The session labels in the middle of the graph indicate when each session began with respect to the y-axis. Note that group assignment was not made until after the baseline drinking measures were collected, and groups were explicitly matched for baseline drinking behavior. There were no significant group differences in either the maximum drinking rate or in the latency to reach it.

