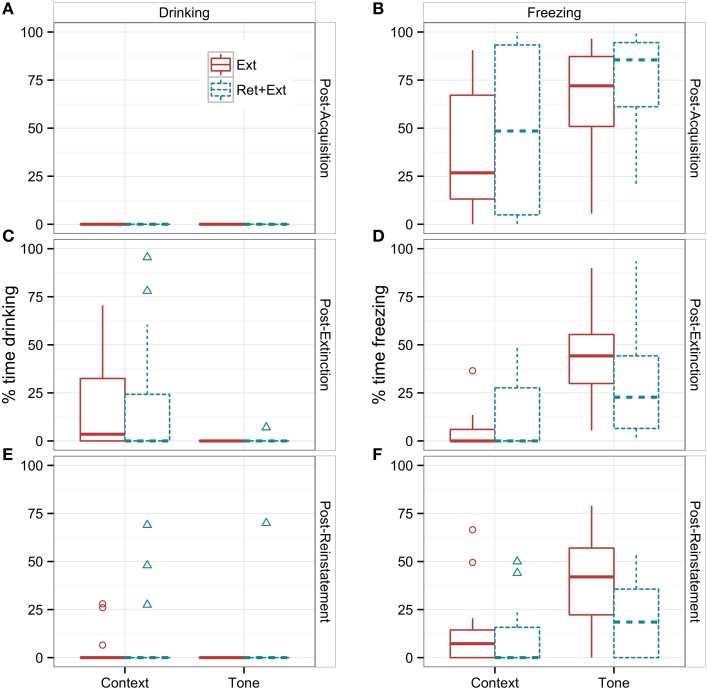
Figure 4.
Tests of fear vs. extinction memory as indicated by percent time drinking (A,C,E) and percent time freezing (B,D,F) measured during pre-CS (Context) vs. CS (Tone) during the first post-acquisition trial (A,B), post-extinction trial (C,D), and post-reinstatement trial (E,F). Data are presented as boxplots to demonstrate their range and distribution, which differ markedly between drinking vs. freezing and between tone vs. context. Boxes represent the middle 50% of the distribution (the interquartile range between the 25th and 75th percentiles), and the horizontal line indicates the median. The “whiskers” that extend vertically from the box indicate the range of observations that fall within ±1.5 times the interquartile range, and any observations outside the whiskers are graphed as individual points. Note the complete suppression of drinking (A) vs. the large variability in freezing (B) following fear conditioning. A significant mean difference between Ext vs. Ret + Ext groups was only observed for tone-CS freezing following reinstatement (F).

