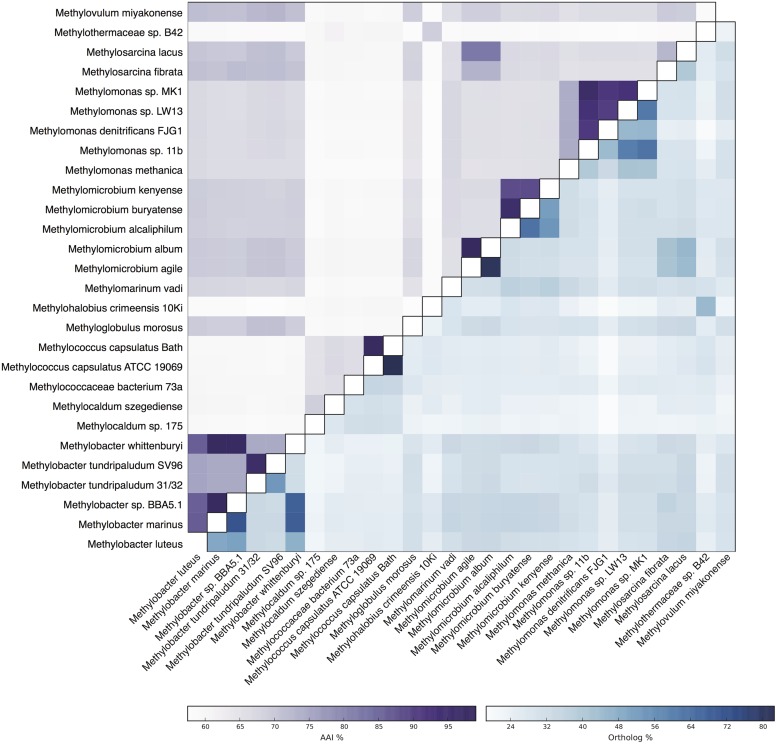
FIGURE 3.
Heatmap of genome relatedness between B42 and other gammaproteobacterial methanotrophs. The average amino acid identity (AAI) between homologous proteins between pairs of genomes is shown in the upper triangle. The percentage of total proteins that are homologous is shown in the lower triangle.

