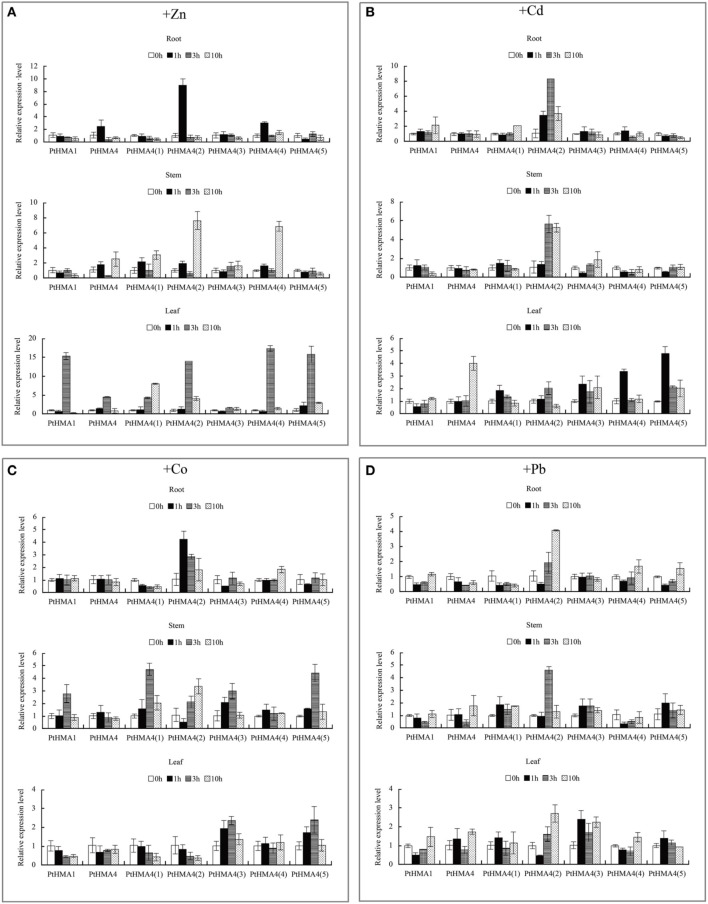
Figure 5.
Expression profiles of the PtHMA genes under heavy metal conditions. QRT-PCR was used to analyze the expression patterns of 7 PtHMA genes in the roots, stems, and leaves under excessive amounts of Zn (A), Cd (B), Co (C), and Pb (D). X-axis represents different genes. The y-axis represents relative gene expression levels normalized to the Populus reference gene, actin. Standard deviations were derived from three replicates of each experiment.

