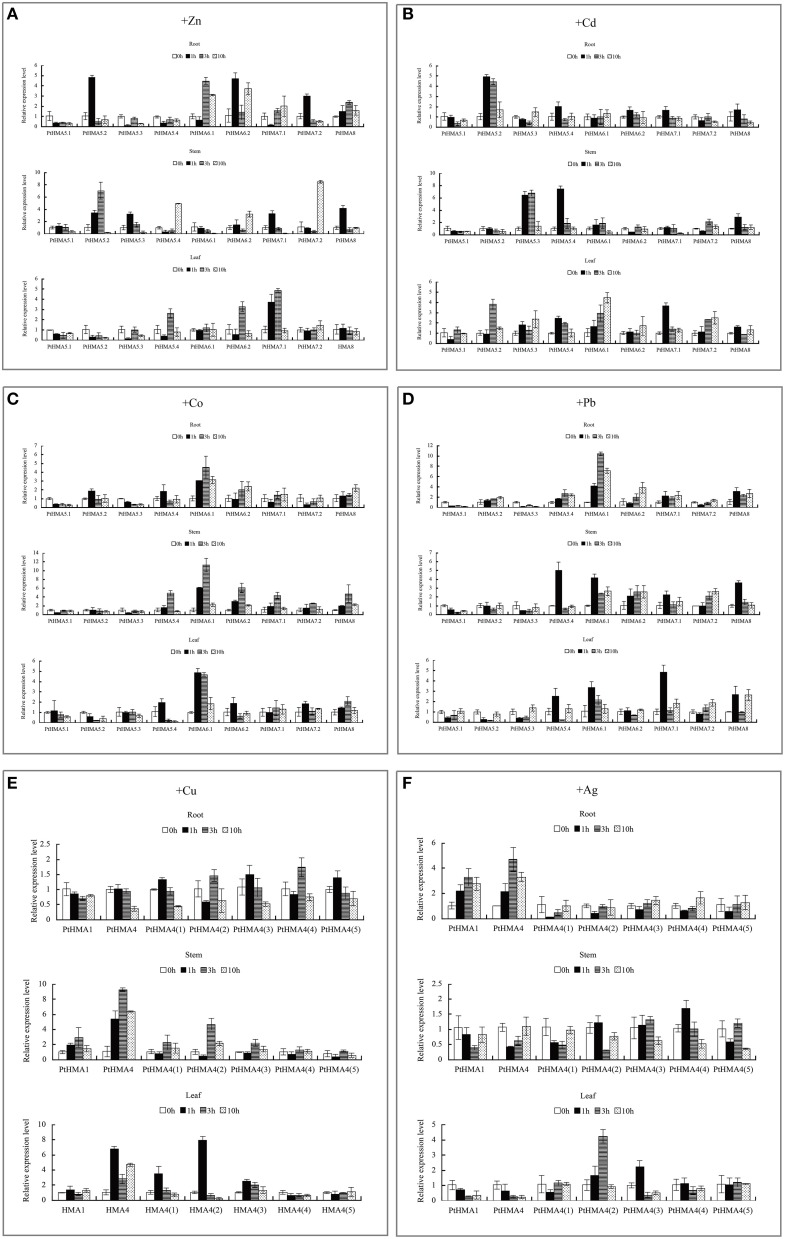
Figure 7.
qRT-PCR was used to analyze the expression patterns of nine PtHMA genes in the roots, stems, and leaves under excessive amounts of Zn (A), Cd (B), Co (C), and Pb (D), and seven PtHMA genes in the roots, stems, and leaves under excessive amounts of Cu (E) and Ag (F). X-axis represents different genes. The y-axis represents relative gene expression levels normalized to the Populus reference gene, actin. Standard deviations were derived from three replicates of each experiment.

