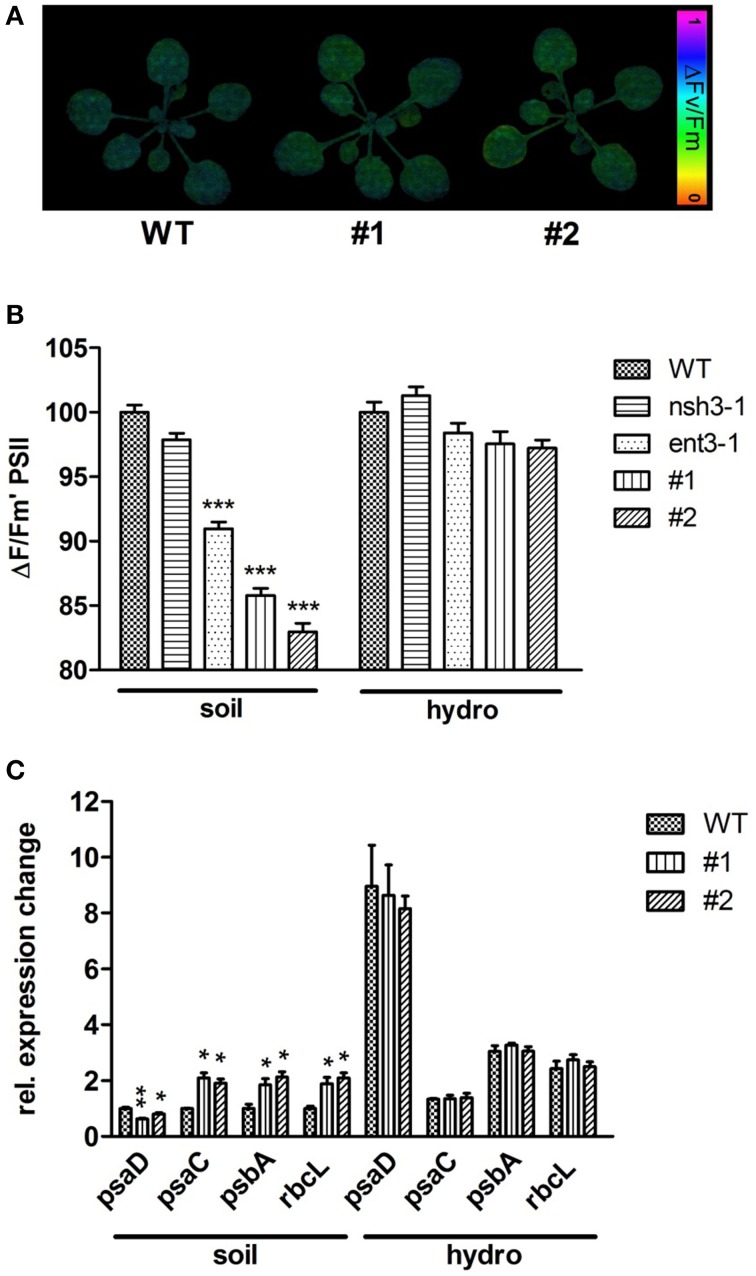
Figure 6.
Photosynthetic efficiency and expressional analysis of photosynthesis related genes. (A) PSII efficiency of 3 week old WT, ENT3, and NSH3 single and double knockout mutants grown on soil and hydroponic culture was examined using a MINI-IMAGING-PAM fluorometer (Walz Instruments, Effeltrich, Germany). Altered PSII efficiencies (ΔFM/Fm′) were indicated by color changes. (B) Quantification of PSII efficiency. Data represent means ± SE of at least 10 plants. Differences between lines were analyzed with One-way ANOVA and a Bonferroni correction at the 95% confidence level (***P < 0.001). (C) Expressional analysis of photosynthesis related genes using quantitative RT-PCR. The expression of PSAC, PSAD, PSBA and RBCL was normalized using the geometric meridian of the housekeeping genes GAPDH, ACTIN, and 18SRNA. Data represent means ±SE of three biological replicates. Differences between lines were analyzed with One-way ANOVA and a Bonferroni correction at the 95% confidence level. *P < 0.05; **P < 0.005.

