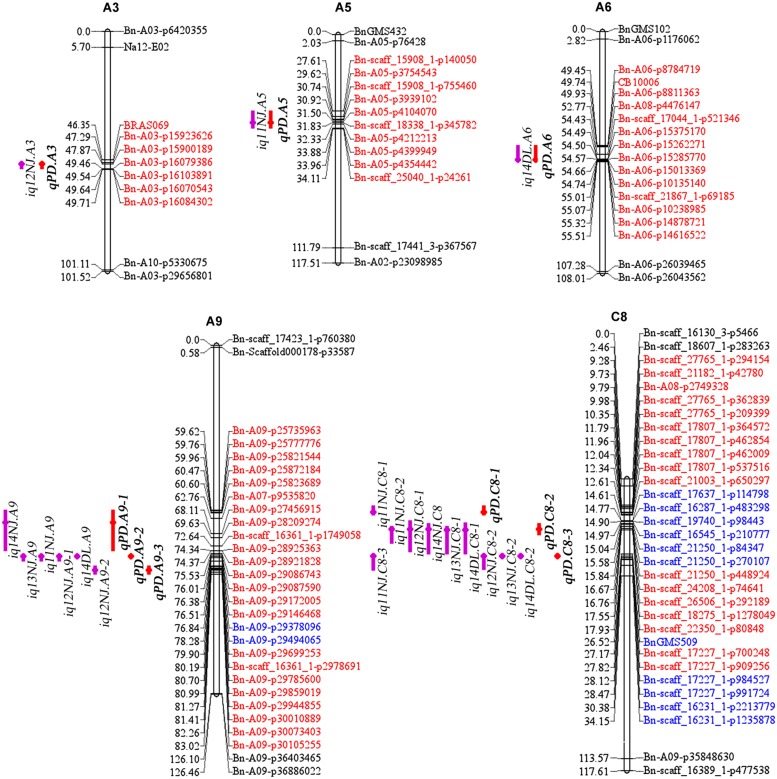
FIGURE 4.
The locations of identified and consensus QTLs associated with PDgr in the AH map. The linkage groups are represented by vertical bars. The loci names are listed on the right side of the linkage groups, while the loci positions are shown on the left side of the linkage groups. For simplicity, only the markers underlying the QTL CIs and the terminal two markers of each linkage group are shown. QTLs for PDgr are represented by bars with different backgrounds on the left side of each linkage group (purple bars, identified QTLs and red bars, consensus QTLs). Red loci are underlying the CIs of consensus QTLs and blue loci are underlying the CIs of identified QTLs but not consensus QTLs.

