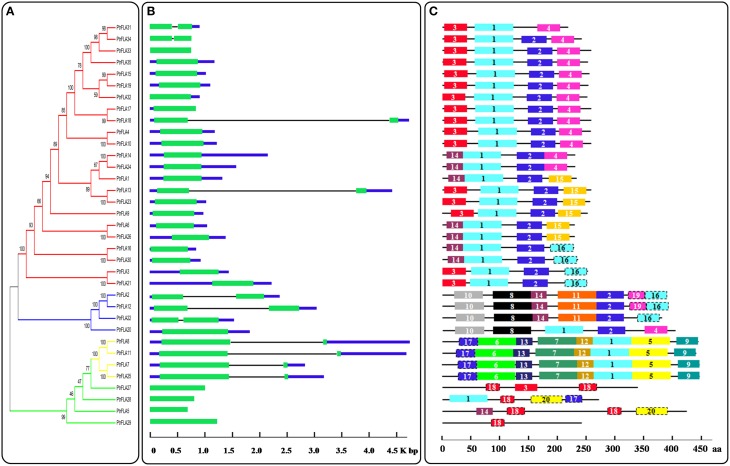
Figure 4.
Phylogenetic relationships, gene structure and motif compositions of PtrFLAs. (A) The full-length PtrFLA protein sequences were aligned by Clustal X 2.0 and the un-rooted tree was generated with the MEGA5.0.5 by Neighbor-Joining (NJ) method with 1000 bootstrap replicates. The branches of different groups were painted with different colors. (B) Exon/intron structures of the PtrFLAs. Green boxes represent exons and black lines represent introns. (C) Conserved motif analysis of PtrFLAs by MEME. Different motifs are represented by different colored boxes with number 1–20.

