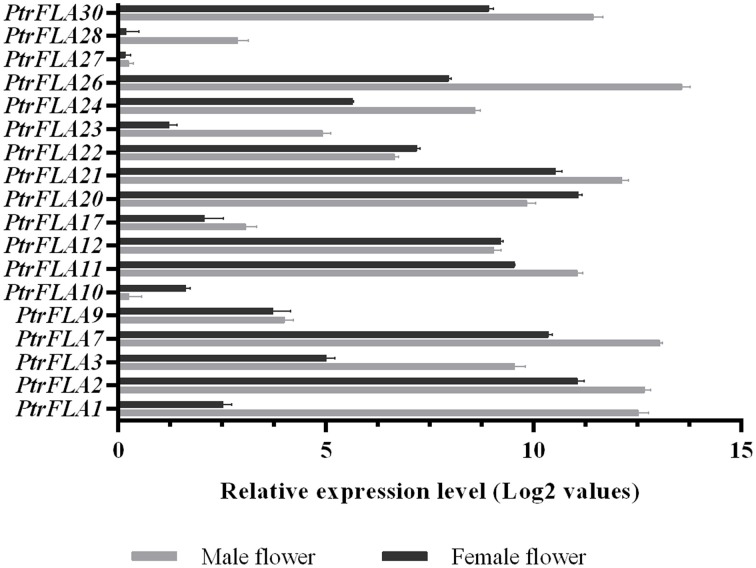
Figure 7.
Expression analysis of 18 selected PtrFLA genes in male inflorescences and female inflorescences by qRT- PCR. The expression level of each gene was calculated relatively to the transcript lowest expressed in male or female inflorescences. Error bars represent standard error for three replicates.

