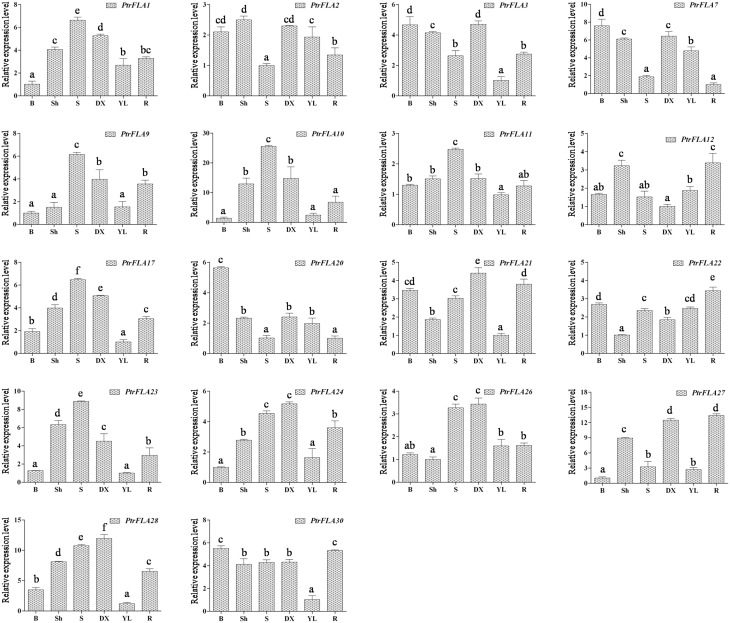
Figure 8.
Expression analysis of 18 selected PtrFLA genes in different vegetative tissues by qRT- PCR. B, leaf buds; Sh, apex shoots; S, stems; DX, differentiating xylem; YL, young leaves; R, roots. The expression level of each gene was calculated relatively to the average biological replicate of sample which was expressed at lowest level. Different letters indicate statistically significant differences when analyzed by One-way ANOVA and a multiple comparison using Tukey' s test at P ≤ 0.05. Data represent nine individual Ct values of each sample. Error bars represent standard error for three replicates.

