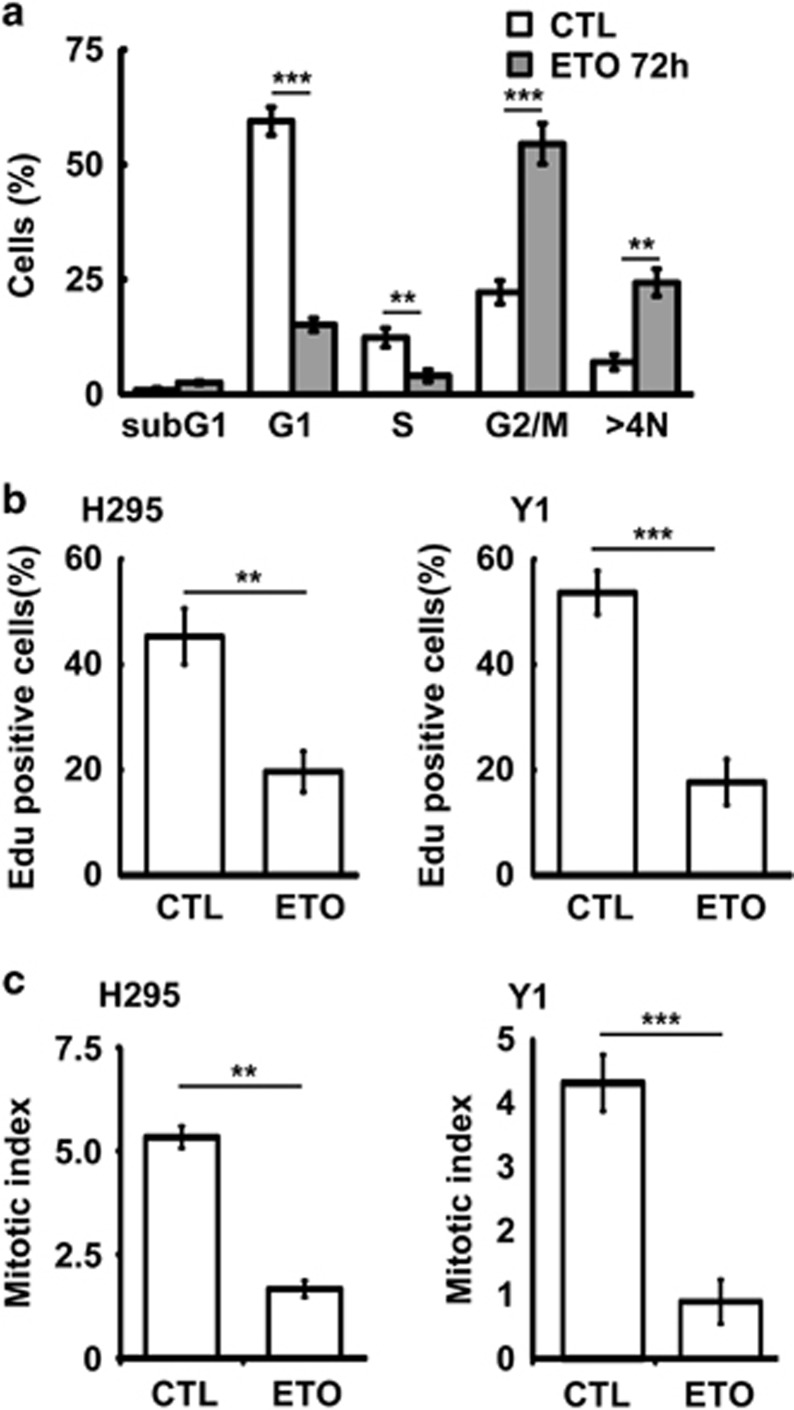
Figure 2.
Sublethal dose of ETO treatment disturbs cell cycle profile. (a) ETO treatment (10 μM, 72 h) disturbs the cell cycle profile. Quantification of different cell cycle stages in adrenocortical Y1 tumor cells in the presence or absence of ETO. (b and c) EdU incorporation and mitotic index are reduced in ETO-treated (10 μM, 24 h) adrenocortical H295 and Y1 tumor cell lines. Quantification of EdU incorporation (b) or mitotic index (c) in scramble control (CTL) or ETO-treated H295 and Y1 cell lines. These results are mean +/−s.d. from three independent experiments; more than 1000 cells were counted in each individual group. **P<0.01, ***P<0.001.

