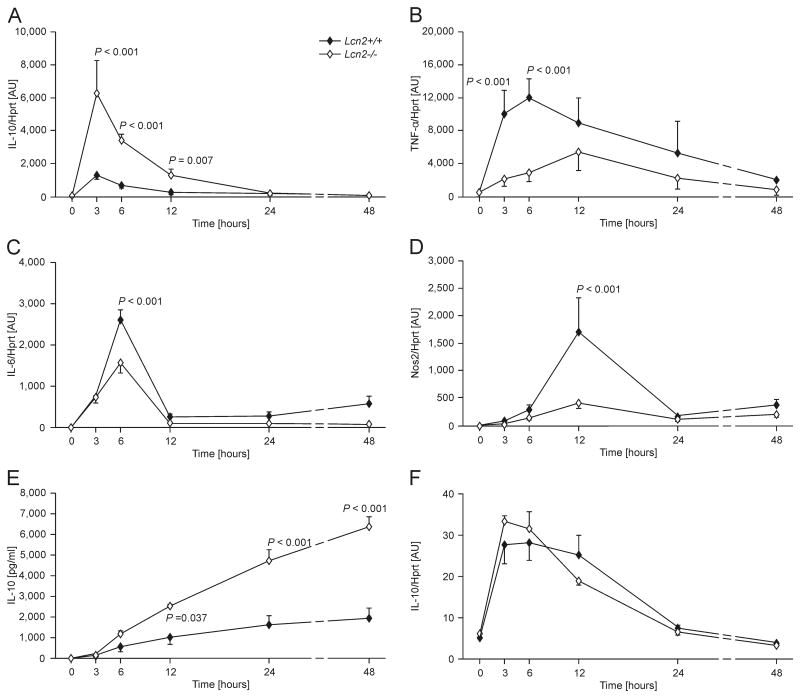
Figure 2. Time-dependent differences in immune genes expression between wt and Lcn2-/- peritoneal macrophages.
Wt (closed symbols) and Lcn2-/- peritoneal macrophages (open symbols) were treated with PBS (Ctrl.) or infected with Salmonella Typhimurium (S. Tm.) for 3 to 48 h. IL-10 (A), TNF-α (B), IL-6 (C) and Nos2 (D) expression was determined by qRT-PCR, and data were normalized for mRNA levels of Hprt and compared by ANOVA using Bonferroni's correction for multiple tests. Values are depicted as means ± S.E.M and statistically significant differences between cells of the two genotypes are indicated (n = 4-12 individual values from 4 independent experiments). (E) IL-10 concentrations in cell culture supernatants were determined by a specific ELISA. IL-10 concentrations in PBS-treated cells were below the detection limit of the ELISA kit used and are depicted as 0. Data were compared by ANOVA using Bonferroni's correction for multiple tests. Values are depicted as means ± S.E.M and statistically significant differences between cells of the two genotypes are indicated (n = 4 individual values from 4 independent experiments). (F) In parallel, Lcn2+/+ and Lcn2-/- peritoneal macrophages were treated with PBS (Ctrl.) or with the same number of heat-inactivated Salmonella Typhimurium (S. Tm.) for 3 to 48 h. IL-10 mRNA expression was determined by qRT-PCR, and data compared by ANOVA using Bonferroni's correction for multiple tests. Values are depicted as means ± S.E.M and statistically significant differences between cells of the two genotypes are indicated (n = 4-12 individual values from 4 independent experiments). Note that the x-axis is non-linear between the 24 and 48 h time-points for the sake of better illustration.

