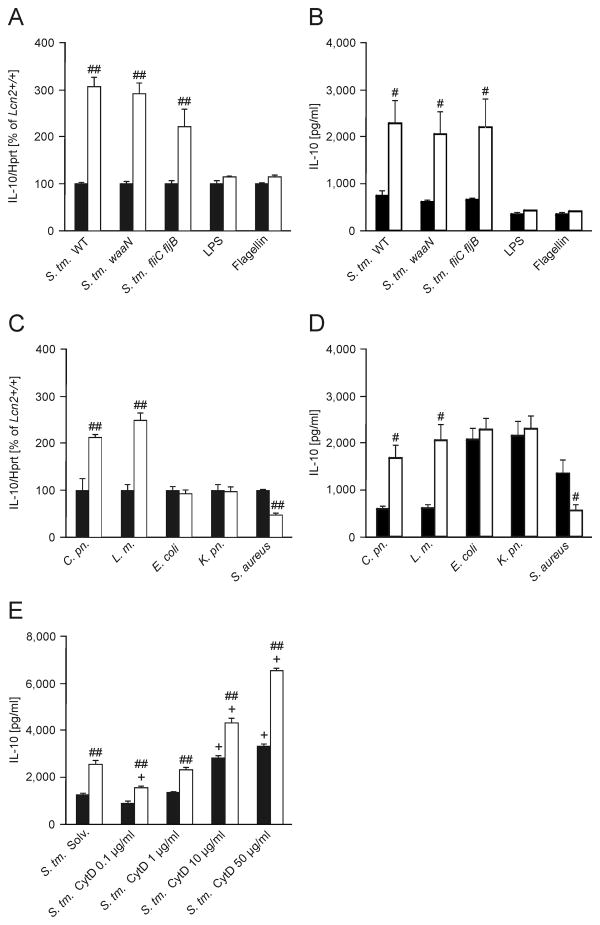
Figure 3. Lcn2 affects IL-10 mRNA expression in response to intracellular pathogens.
(A) Wt (closed bars) and Lcn2-/- peritoneal macrophages (open bars) were infected with Salmonella Typhimurium (S. Tm.) wt or isogenic mutants with modified LPS (waaN) or lacking flagellin (fliC fljB) at a MOI of 10:1 for 3 h. In parallel, wt and Lcn2-/- peritoneal macrophages were treated with 100 ng/ml LPS or flagellin isolated from Salmonella Typhimurium (n = 6 individual values from 4 independent experiments). IL-10 mRNA expression was determined by qRT-PCR and normalized for mRNA levels of Hprt. Results are reported relative to expression in wt peritoneal macrophages. Bars show means + S.E.M. from 6 independent experiments. P values were compared by independent sample t test. ## P value < 0.01 for the comparison of the two Lcn2 genotypes. (B) IL-10 secretion was assessed by measuring cytokine concentrations in culture supernatants of cells infected/stimulated for 6 h by ELISA. Data were compared as in A. Bars show means + S.E.M. from 4-5 experiments. # P value < 0.05 for the comparison of the two Lcn2 genotypes. (C) Wt and Lcn2-/- peritoneal macrophages were infected for 3 h at a MOI of 10 with Chlamydia pneumoniae (C. pn.), Listeria monocytogenes (L. m.), Escherichia coli (E. coli), Klebsiella pneumoniae (K. pn.) or Staphylococcus aureus (S. aureus). IL-10 mRNA expression relative to Hprt levels was determined and reported as in A. Bars show means + S.E.M. from 6 independent experiments. (D) IL-10 secretion was assessed by measuring cytokine concentrations in culture supernatants of cells infected for 6 h. Data were compared as in A (n = 4 independent experiments). # P value < 0.05 for the comparison of the two Lcn2 genotypes. Bars show means + S.E.M. from 4 independent experiments. (E) Wt and Lcn2-/- BMDM were preincubated with increasing concentrations of cytochalasin D (CytD) as indicated for 1 h and subsequently infected for 12 h before supernatants were harvested for IL-10 measurement (n = 3 independent experiments). Bars show means + S.E.M. from 3 independent experiments. ## P value < 0.01 for the comparison of the two Lcn2 genotypes. + P value < 0.01 for the comparison to solvent-treated cells of the respective genotype.

