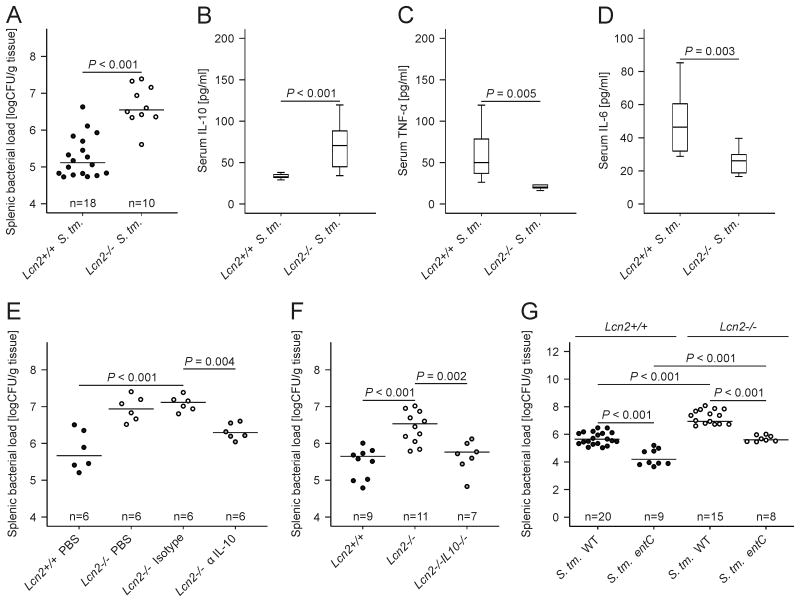
Figure 7. IL-10 neutralization or deletion restores bacterial killing in Lcn2-/- mice.
(A-D) Wt and Lcn2-/- mice were infected with 500 CFU wt Salmonella Typhimurium (S. Tm.) for 72 h. The bacterial load in spleen was determined by plating serial dilutions of tissue lysates (A). Serum concentrations of IL-10 (B), TNF-α (C) and IL-6 (D) of Salmonella Typhimurium-infected wt and Lcn2-/- mice were determined by a specific ELISA after 72 h. (A) Each dot shows an individual mouse, bars indicate means (B-D) Results were compared by t test and are depicted as lower quartile, median and upper quartile (boxes) with minimum and maximum ranges and statistical significance between mice of the two genotypes as indicated (n = 10-18 individual mice per group). (E) Wt and Lcn2-/- mice were infected with wt Salmonella Typhimurium (S. Tm.) for 72 h. Lcn2-/- mice were enrolled in 1 of 3 treatment groups receiving either solvent (PBS), a control monoclonal IgG antibody (isotype) or a neutralizing monoclonal IL-10 antibody (α IL-10). Wt mice were treated with solvent and the bacterial load in spleen was determined by plating serial dilutions of tissue lysates. Each dot shows an individual mouse, bars indicate means. Values were log-transformed and compared by ANOVA using Bonferroni correction (n as indicated). (F) Wt (closed circles), Lcn2-/- (open circles) and Lcn2-/- IL-10-/- mice (grey circles) were infected with wt Salmonella Typhimurium (S. Tm.) for 72 h. The bacterial load in spleen was determined by plating serial dilutions of tissue lysates. Each dot shows an individual mouse, bars indicate means. Values were log-transformed and compared by ANOVA using Bonferroni correction (n as indicated). (G) Wt and Lcn2-/- mice were infected with 500 CFU wt Salmonella Typhimurium (S. Tm.) or the siderophore-deficient entC mutant for 72 h. The bacterial load in spleen was determined by plating serial dilutions of tissue lysates. Each dot shows an individual mouse, bars indicate means. Values were log-transformed and compared by ANOVA using Bonferroni correction (n as indicated).

