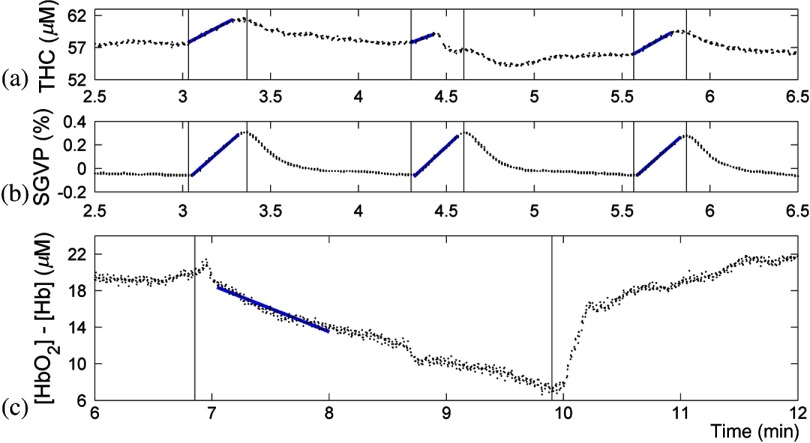
Fig. 4.
Zoomed-in view of the illustrative subject (subject 4) calibration occlusion responses. (a) The optical THC slope during VO was used to calculate arterial inflow (baseline BF). A MATLAB® polyfit function was used to determine the slope. (b) The SGVP slope during VO was used to calculate baseline limb BF. Simultaneous time registries indicated both methods to determine BF are sensitive to VO. (c) The hemoglobin concentration change slope () during AO was used to determine baseline oxygen consumption rate (). Optical data showed initial increases as the pressure cuff reached VO pressure and then AO pressure. One-minute AO is sufficient to calculate , whereas 3-min AO was used to confirm hyperemic response and verify occlusion integrity.

