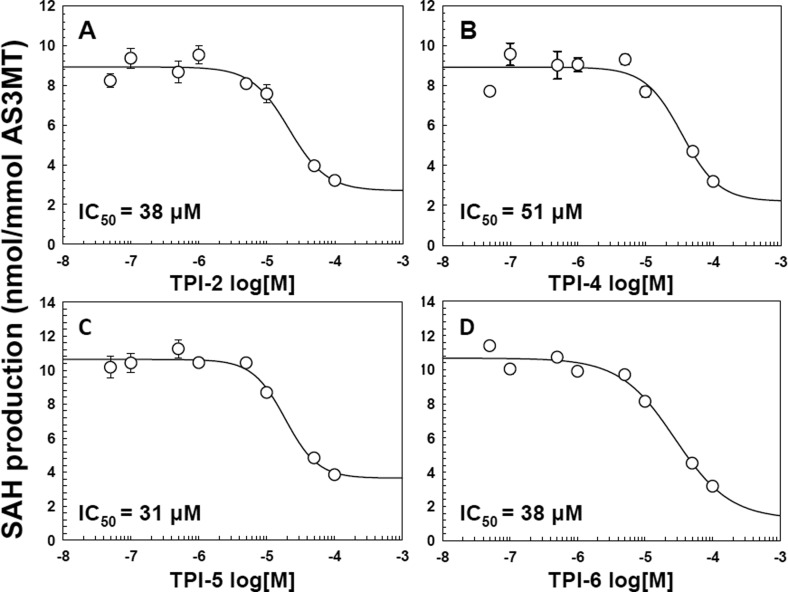
Figure 2.
Dose–response relationship of TPIMS inhibitors and hAS3MT activity. The activity of hAS3MT was assayed as described in the legend to Figure 1 in the presence of the indicated concentrations of (A) TPI-2; (B) TPI-4; (C) TPI-5; or (D) TPI-6. The inhibitor concentrations of half-maximal inhibition (IC50) were calculated as 38 μM for TPI-2, 51 μM for TPI-5, 31 μM for TPI-5, and 38 μM for TPI-6. The data were fitted using SigmaPlot. The data are the mean ± SE (n = 3).

