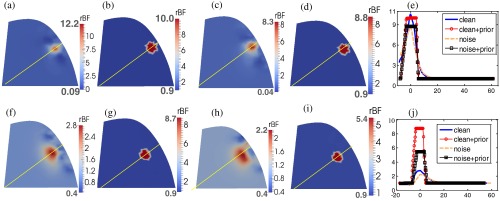
Fig. 7.
Comparison of anomaly reconstructions without and with a priori structural information. The top [(a)–(e)] and bottom [(f)–(j)] panels show the reconstructed flow contrast distributions of an anomaly (assigned a 10-fold flow contrast) located at 7 and 15 mm central depths, respectively. (a) and (f) show reconstructed results without the a priori structural knowledge of the anomaly; (b) and (g) show the reconstructed results with the a priori structural knowledge; (c) and (h) show the reconstructed results without the a priori structural knowledge and with noise. (d) and (i) show the reconstructed results with the a priori knowledge information and with noise. The flow contrast profiles crossing the yellow lines are shown in (e) and (j).

