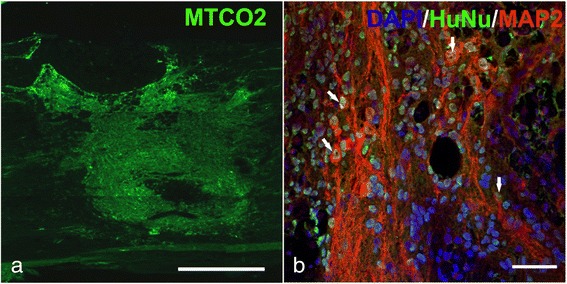
Fig. 2.

MTCO2-positive transplanted cells in the host spinal cord 8 weeks after i.s. implantation of iPS-NPs. Scale bar = 500 μm a. HuNu-positive transplanted cells (green) express the neuronal marker MAP2 (red). Nuclei are stained by DAPI (blue). Colocalization is marked by arrows. Scale bar = 50 μm b. DAPI 4',6-diamidino-2-phenylindole, HuNu human nuclei, MAP2 microtubule-associated protein 2
