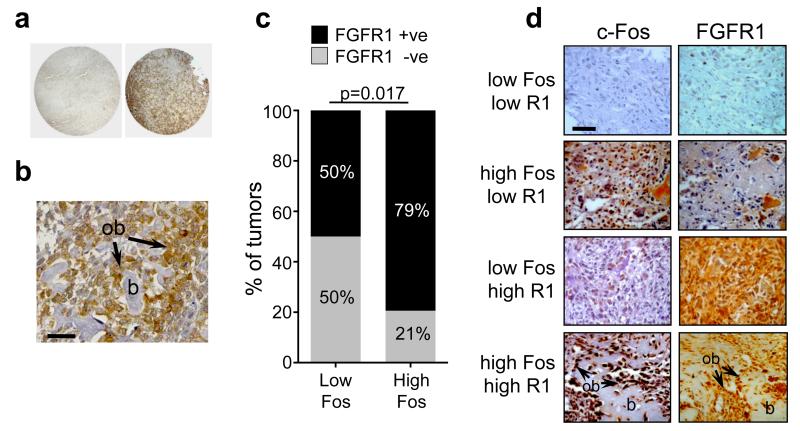
Figure 5.
(a) Representative human TMA tumour samples showing negative (left) and positive (right) FGFR1 protein expression by immunohistochemistry. (b) Representative osteosarcoma biopsy showing high FGFR1 expression also localised to transformed osteoblasts (ob) lining bone (b). (c) Quantification of percentage of tumours that express low or high c-Fos protein, and are either FGFR1-negative or FGFR1-positive. The data correspond to raw data presented in Table 1b (bottom panel). p=0.017; Fischer’s exact test. (d) Representative histological samples of c-Fos and FGFR1 protein staining combinations as indicated. High expression of both c-Fos and FGFR1 are also observed in osteoblasts (ob) lining neoplastic bone (b). Bars, 50μm.

