Fig. 5.

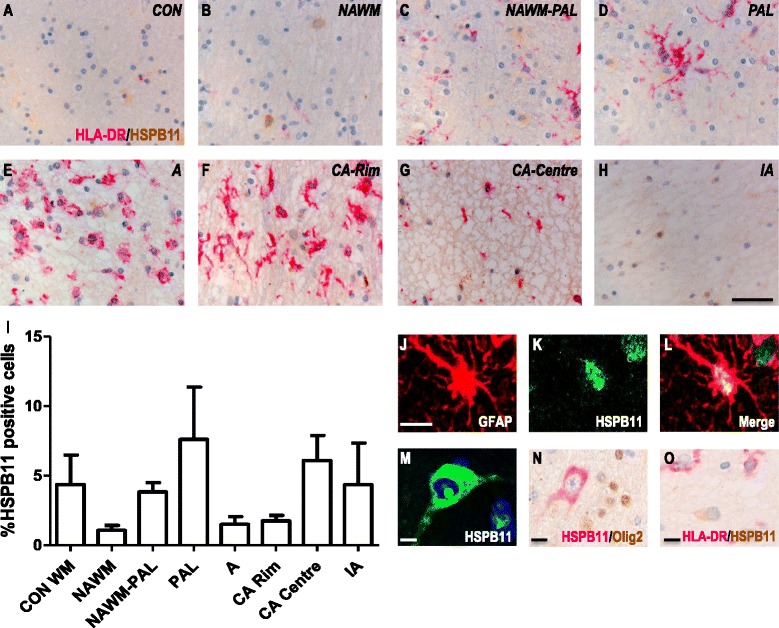
HSPB11 expression in white matter MS lesions. Images of white matter tissues from non-neurological controls (a) and MS cases (b–h) double labelled for HLA-DR (pink) and HSPB11 (brown). NAWM (b), NAWM surrounding a preactive lesion (c), preactive lesion (d), active lesion (e), chronic active lesion (f- rim, g - centre) and inactive lesions (h) from MS cases. Quantification of HSPB11+ cells in lesion areas (i). HSPB11 co-localises with GFAP+ astrocytes (j–l), and is expressed by white matter neurons (m) while Olig2+ oligodendrocytes (n) or HLA-DR+ microglia (o) do not express HSPB11. Percentages of cells in each area (i). Data are shown as mean ± SEM. Statistical analysis is performed by Mann- Whitney U test, comparing control white matter and NAWM or NAWM and the separate lesion types, no significant differences are found. Scale bar (a–h) = 50 μm, (j–o) = 10 μm. CON = control, NAWM = normal appearing white matter, PAL = preactive lesions, A = active lesion, CA = chronic active lesions, IA = inactive lesions
