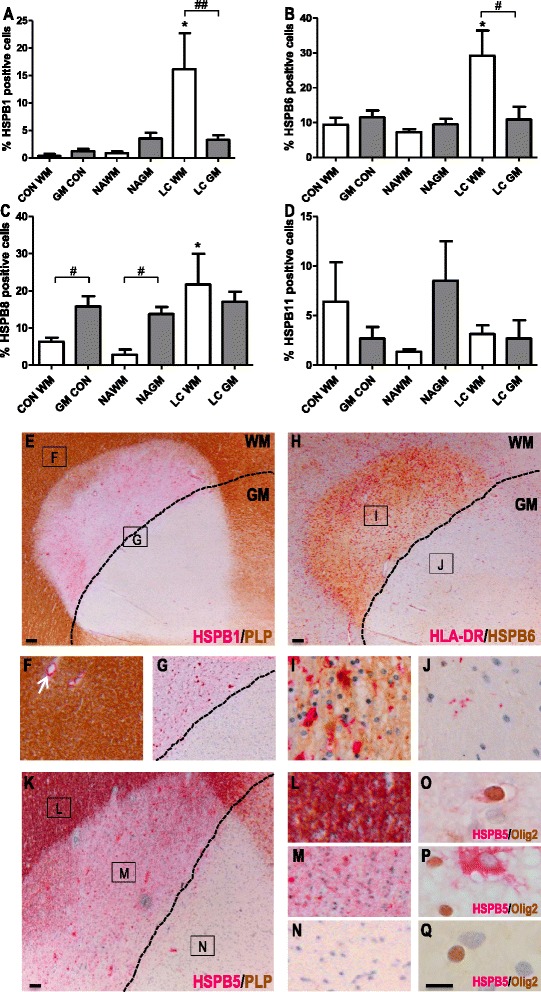
Fig. 7.

Small HSP expression in leukocortical MS lesions. Expression of HSPB1 (a), HSPB6 (b), HSPB8 (c) and HSPB11 (d) was quantified in the white matter (white bars) and grey matter (grey bars) area of leukocortical MS lesions compared to NAWM and NAGM in MS cases, and control white and grey matter in controls. e A leukocortical lesion identified by a focal area of myelin loss depicted by PLP staining (brown). The border between WM and GM is depicted by a black line (also in g, h and k). Immunohistochemistry shows the marked difference in HSPB1 expression in the WM and GM parts of the LC lesion. f In the NAWM HSPB1 expression is limited to blood vessels (arrow). g Enlargement of area in (e) shows HSPB1 expression (pink) is restricted to the white matter part of the lesion. h HSPB6 expression (brown) in an active leukocortical lesion containing HLA-DR+ microglia/macrophages (pink) restricted to the WM part (i). HSPB6 is highly expressed in the WM part (i) and absent in the grey matter part (j). k A leukocortical lesion identified by a focal area of myelin loss depicted by PLP staining (brown). HSPB5 (pink) is selectively expressed in oligodendrocytes in preactive lesions (data not shown) in NAWM close to the WM/GM border (l, o), while in the active WM part (m) HSPB5 accumulates also in astrocytes (p) but not in the GM part of the lesion (n, q). Statistical analysis (a–d) is performed by a Mann-Whitney U test, comparing white and grey matter groups with each other (#) or comparing NAWM or NAGM with the control or lesion group (*) . # p < 0.05; ## p < 0.01; *p < 0.05. Scale bars e, h, k = 100 μm; o–q = 50 μm; f–g, i–j, l–n = digitally zoomed in. CON = control, WM = white matter, GM = grey matter; NAWM = normal appearing white matter, NAGM = normal appearing grey matter, LC = leukocortical lesions
