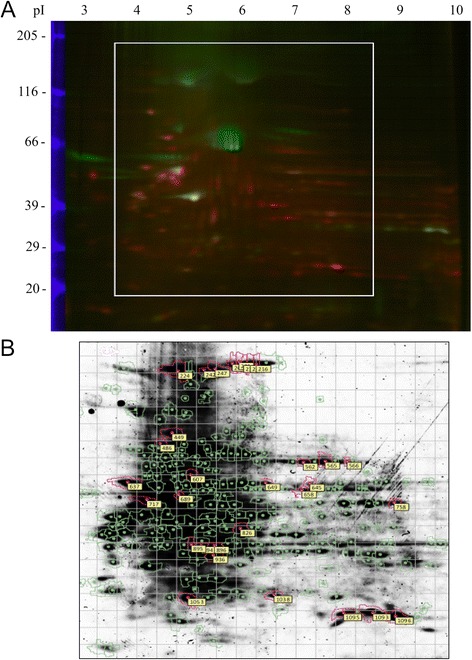
Fig. 6.

2D-DIGE analysis of OBC matrix proteins. a A fluorescent image of a representative 2D gel. Blue bands at left represent fluorescent Mr standards. DOC-treated OBC matrix proteins were labeled with Cy3 (green); water-lysed OBC matrix proteins with Cy5 (red). The linear, immobilized IEF gradient gel is at the top with the acidic end (pH 3) at the left and the basic end (pH 10) at the right. The white box shows the approximate area of the Coomassie-stained gel shown in (b) from which the protein spots were excised. Excised spots are circled in pink and labeled with a spot number. 2D-DIGE 2D-differential in-gel electrophoresis, OBC osteoblastic cells, IEF isoelectric focusing gel
