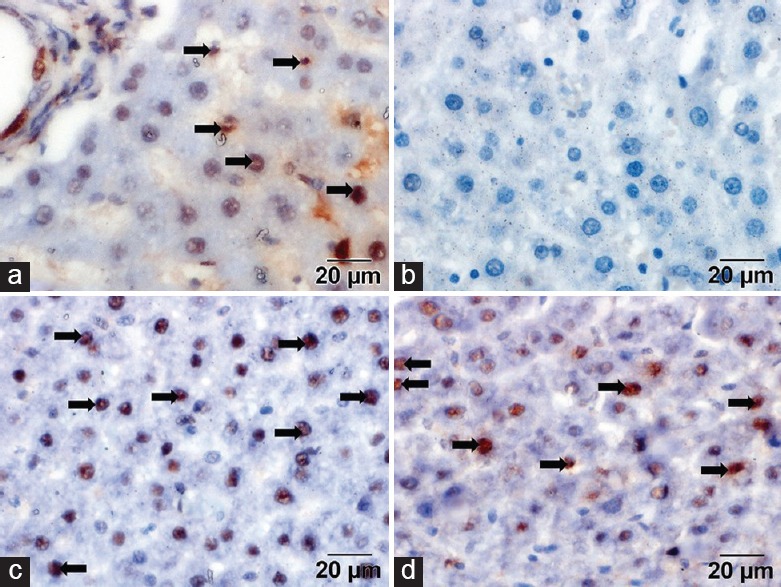
Figure 2.

(a) Control group showed moderate immunoreactivity (arrows). (b) Doxorubicin group showed minimal or no immunoreactivity in the nuclei (arrows). (c) Doxorubicin and coenzyme Q10 groups showed intense expression (arrows). (d) Doxorubicin and Cynara scolymus groups showed intense expression (proliferating cell nuclear antigen, scale bar = 20 μm)
