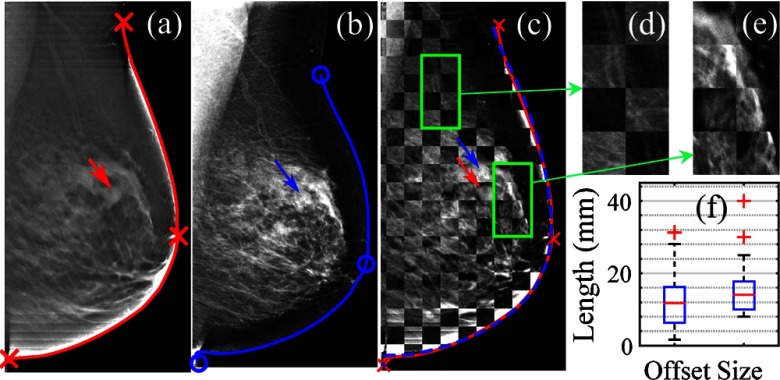
Fig. 1.
(a) Middle-axial slice of the digital breast tomosynthesis (DBT) scan; (b) 2-D mammogram of the same breast; (c) checker-box () overlay of (a) and (b) after registration; (d and e) zoom-in views; and (f) box-plots of the registration lesion offsets (left) and lesion sizes (right). Mammogram breast contours before (blue solid) and after (blue dashed) registration are shown and compared with the reference (red).

