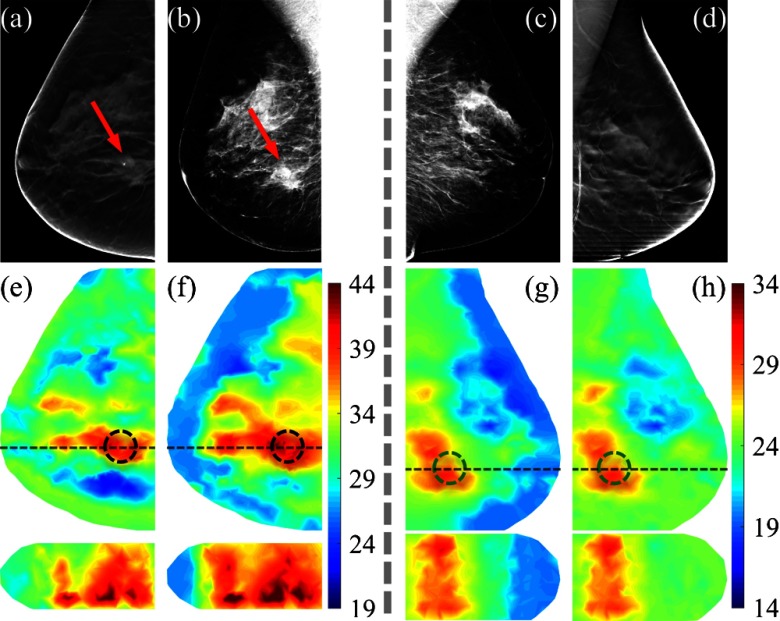
Fig. 2.
(a,d) Axial slices of the DBT and (b,c) 2-D mammograms of a breast containing a 25-mm malignant tumor (a,b) and its contralateral normal breast (c,d), respectively; (e–h) the recovered total hemoglobin concentration (HbT, ) images in axial (top) and sagittal views (bottom) using adipose and fibroglandular tissue compositional priors derived from the corresponding x-ray images in the top row. The true (black) and mirrored (green) tumor regions-of-interest are marked using dashed circles. The sagittal cross-sections are marked by horizontal dashed lines in the axial views above.

