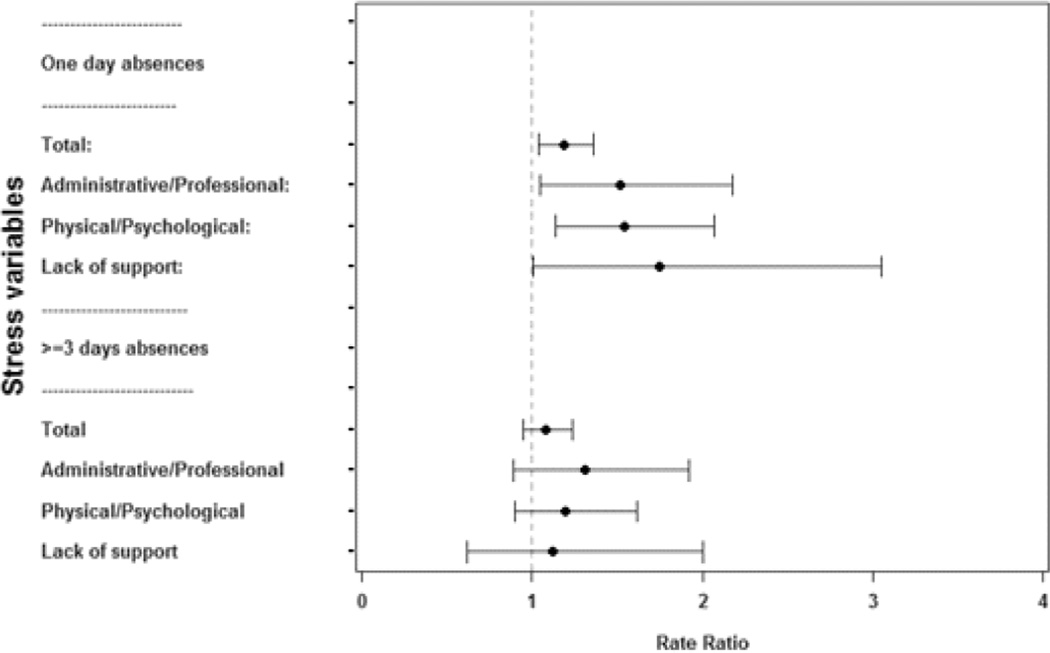
Figure 1. Forest Plot showing rate ratios of one-day and three-day work absences as a function of police specific stress. Rate ratios were adjusted for demographic and life style variables.*.
* This forest plot is a graphical representation of associations between police stress and work absence in this study. The left-hand column lists the types of police stress. The right-hand column is a plot of the estimated rate ratios for each of the stress types incorporating confidence intervals represented by horizontal lines. The dashed vertical line represents no effect. If the confidence interval crosses this line, it demonstrates that at the given level of confidence the effect size is not significant. The plot demonstrates that one-day absence is significantly associated with police stressors while three-day absences are not.

