
FIG. 3.
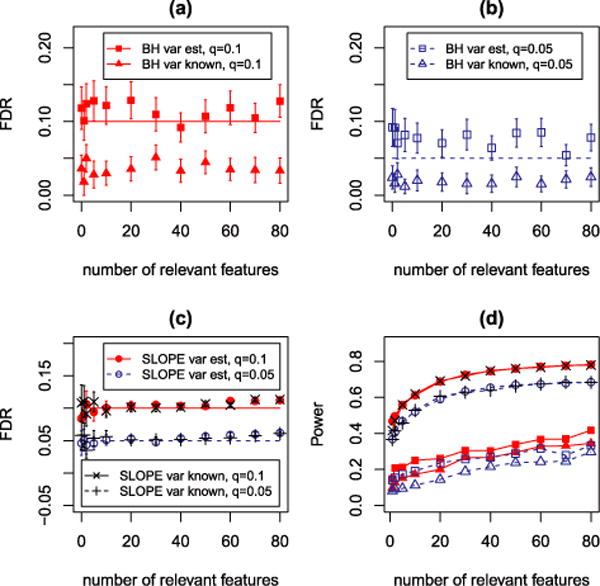
Simulation results for testing multiple means from correlated statistics. (a)–(b) Mean FDP ± 2 SE for marginal tests as a function of k. (c) Mean FDP ± 2 SE for SLOPE. (d) Power plot.
Official websites use .gov
A
.gov website belongs to an official
government organization in the United States.
Secure .gov websites use HTTPS
A lock (
) or https:// means you've safely
connected to the .gov website. Share sensitive
information only on official, secure websites.
Simulation results for testing multiple means from correlated statistics. (a)–(b) Mean FDP ± 2 SE for marginal tests as a function of k. (c) Mean FDP ± 2 SE for SLOPE. (d) Power plot.