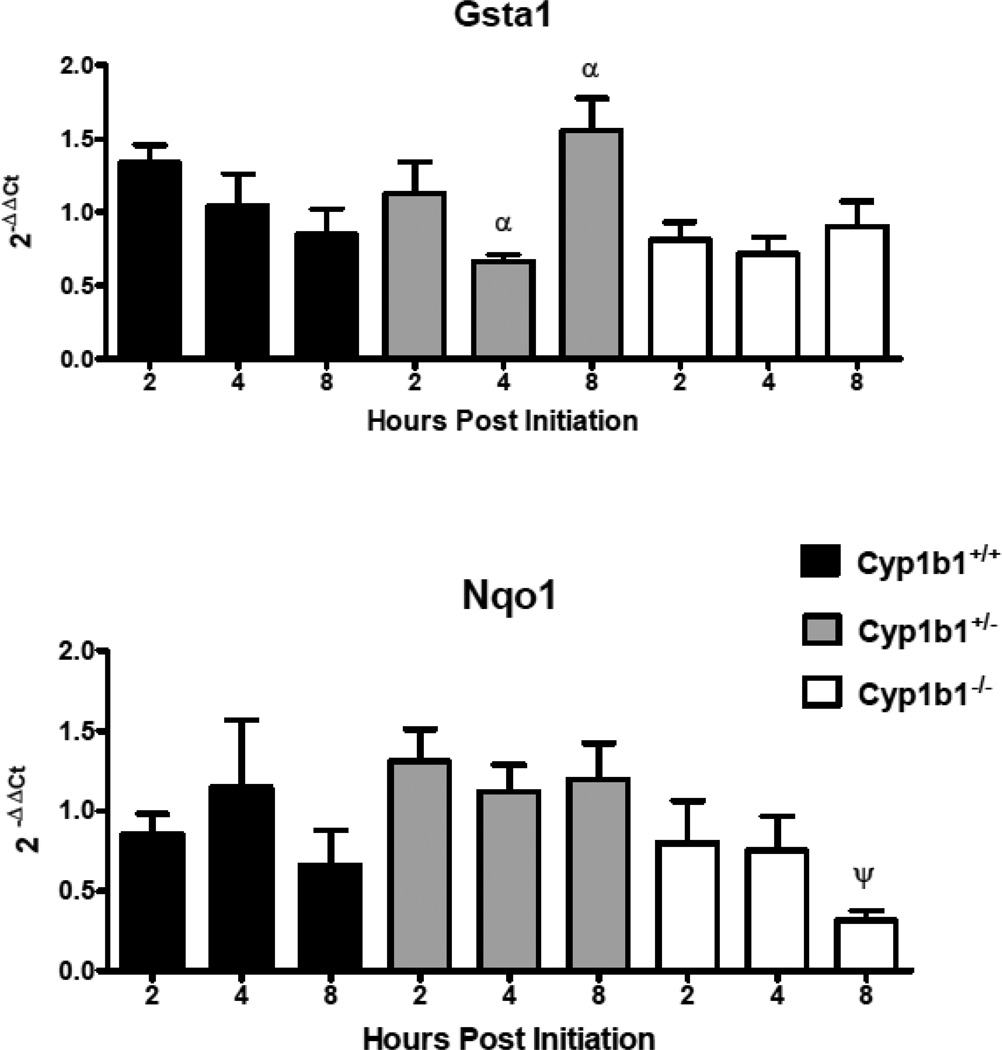
Figure 6.
Relative mRNA expression in selected Phase II metabolizing enzymes measured 2, 4,and 8 h post initiation with 0.125 mL toluene or 400 nmol DBC applied to the shaved dorsal surface of Cyp 1b1+/+ (wt), Cyp 1b1+/− (het), and Cyp 1b1−/− (null) mice. qPCR using the ΔΔCt method of expression in treated animals relative to toluene control are shown as mean ± SE of individual 2−(ΔΔCt) values. ψ indicates significant difference between control and treated based on Mann Whitney two tailed test, α indicates significance between time points using Kruskal-Wallis ANOVA with Dunn’s post-test all p values <0.05.

