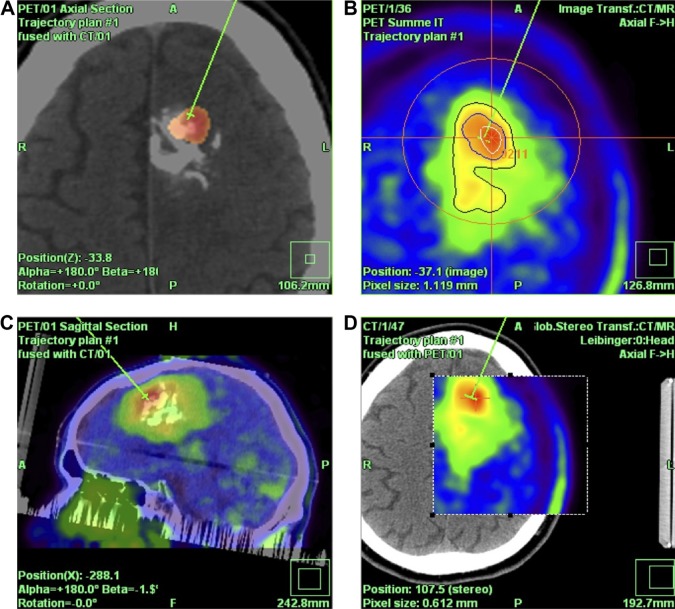
Figure 4.
18F-FET PET-guided stereotactic serial biopsy of a left frontal lesion.
Notes: (A) CT + PET fusion. The green line indicates the biopsy trajectory until the target point inside the contrast-enhancing area. The anterosuperior part of the lesion showed the highest metabolic activity, and was thus selected as the target area. (B) Defining the target point with the automatic hotspot detection tool. (C) Sagittal and (D) axial views of CT-PET fusion.
Abbreviations: FET, fluoroethyl tyrosine; PET, positron-emission tomography; CT, computer tomography.

